|
|
||||||||||||||||||||||||||||||||||||||||||||||||||||||||||||||||||||||||||||||||||||||||||||||||||||||||||||||||||||||||||||||||||||||||||||||||||||||||||||||||||||||||||||||||||||||||||||||||||||||||||||||||||||||||||||||||||||||||||||||||||||||||||||||||||||||||||||||||||||||||||||||||||||||||||||||||||||||||||||||||||||||||||||||||||||||||||||||||||||||||||||||||||||||||||||||||||||||||||||||||||||||||||||||||||||||||||||||||||||||||||||||||||||||||||||||||||||||||||||||||||||||||||||||||||||||||||||||||||||||||||||||||||||||||||||||||||||||||||||||||||||||||||||||||||||||||||||||||||||||||||||||||||||||||||||||||||||||||||||||||||||||||||||||||||||||||||||||||||||||||||||||||||
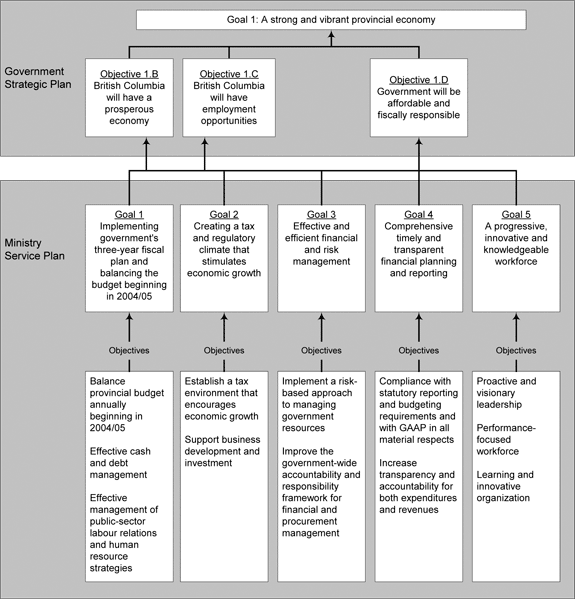
Report on PerformanceOverview of Ministry Goals and Linkage to Government Strategic GoalsEach of the Ministry of Finance's goals and objectives remain consistent with and directly contribute to the achievement of the Government Strategic Plan goal of a "strong and vibrant provincial economy". The ministry's role in contributing to the success of the Government Strategic Plan is illustrated below.
The Ministry of Finance had established five goals in our Service Plan 2004/05 – 2006/07 that guided our activities over the course of the past year. These goals continue to reflect the strategic shifts driven by government's New Era commitments and include:
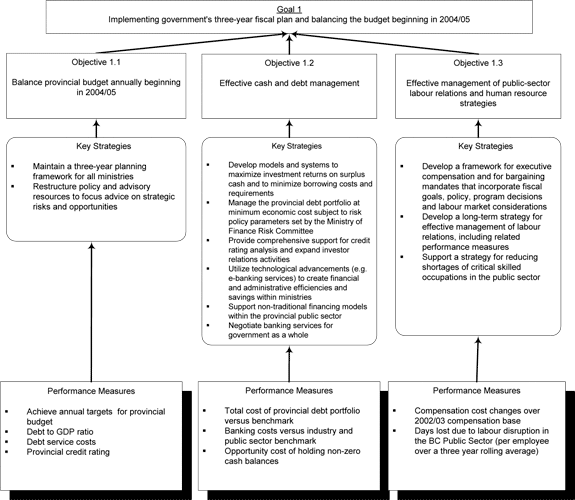
The following section provides further information on the purpose and intended outcomes associated with each of these goals. A number of high-level objectives are also linked to their respective goals to illustrate progress and performance as the ministry pursued our intended future. Goal 1: Implementing government's three-year fiscal plan and balancing the budget beginning in 2004/05.A strong and vibrant provincial economy is a key goal in the government's three-year strategic plan. The ministry assisted government in achieving this goal by maintaining a competitive tax regime and assisting ministries to meet their budget and service plan targets, thereby eliminating the structural deficit and balancing the budget in accordance with the requirements of the Balanced Budget and Ministerial Accountability Act. The ministry also coordinated the management of labour relations policies and practices in the public sector to foster an efficient and effective workforce. Objectives1.1 Balance provincial budget annually beginning in 2004/05. 1.2 Effective cash and debt management. 1.3 Effective management of public-sector labour relations and human resource strategies.
Objective 1.1: Balance provincial budget annually beginning in 2004/05.The province eliminated the government's structural deficit and balanced the budget in 2004/05 in accordance with the requirements of the Balanced Budget and Ministerial Accountability Act. Successfully balancing the provincial budget in 2004/05 represented a significant achievement for government, the ministry and all British Columbians and directly contributed to the achievement of government's three-year strategic plan goal of "A strong and vibrant provincial economy". Looking forward the ministry will continue to work to ensure future budgets are balanced and continue to assist in identifying opportunities to reduce the overall debt burden and improve the province's debt to GDP ratio, which is currently among the lowest of the Canadian provinces. Core Business: Financial and Economic Performance and Analysis.Key Strategies
Performance Measures and Results
Note — See provincial comparisons of Taxpayer supported Debt as a percentage of GDP in Appendix 5.
Note — See provincial comparisons of the Ratio of Taxpayer Supported Debt Service Costs to Taxpayer Supported Revenues in Appendix 5.
Note — See table of comparative provincial credit ratings in Appendix 5. Objective 1.2: Effective cash and debt management.In 2004/05, government managed cash flows totaling more than $100 billion. Debt service cost for the total provincial debt in 2004/05 is estimated to be $2.145 billion. Of this amount, $677 million relates to government operating debt. Accordingly, improvement in the oversight and delivery of cash and debt management on behalf of all government and client programs offers an important opportunity to reduce costs and redirect resources to priority services. Core Business: Treasury.Key Strategies
Performance Measures and Results
Objective 1.3: Effective management of public-sector labour relations and human resource strategies.Compensation costs are a significant component of the provincial budget. Accordingly, effective management of the provincial fiscal plan requires the establishment of appropriate and sustainable compensation levels. Labour market analysis and frameworks are also critical for attracting and retaining those highly-skilled workers that remain critical to the delivery of many public services. Core Business: Public Sector Employers' Council.Key Strategies
Performance Measures and Results
Goal 2: Creating a tax and regulatory climate that stimulates economic growth.The Ministry of Finance continues to play a critical role in the development of a healthy investment climate in the province. Specifically, the ministry is responsible for delivering on the government's commitment to establish a competitive tax environment to support business development and investment. Initiatives that the ministry has undertaken to improve the province's business climate include:
In addition to the tax cuts focused on increasing business investment, the ministry has also delivered on the government's promise to reduce personal income taxes and ensure the personal tax burden of British Columbians is among the lowest in the country. The ministry also supports the government's goal of reducing regulation and red tape, thereby making it easier and more attractive for business to locate and invest in the province. Ministry initiatives include:
Objectives2.1 Establish a tax environment that encourages economic growth. 2.2 Support business development and investment.
Objective 2.1: Establish a tax environment that encourages economic growth.The competitiveness of the taxation environment is a critical consideration for businesses and individuals in deciding whether to invest in the province. Jurisdictions with high tax regimes fail to attract or retain investment. As a result, their economic growth is limited and they forego the resulting additional revenues that sustain government services such as health and education. Core Business: Financial and Economic Performance and Analysis.Key Strategy
Performance Measures and Results
Objective 2.2: Support business development and investment.An important mechanism to promote investment and innovation in the province is the creation of an efficient and effective regulatory and policy framework. Unnecessary regulatory requirements increase the cost of doing business in the province resulting in wasted time and effort for both individuals and businesses. Alternatively, streamlined legislative and policy frameworks supported by the electronic delivery of services can improve investor and consumer protection while acting as a driver for further business development and investment. Core Business: Financial and Corporate Sector Services.Key Strategy
Performance Measures and Results
Goal 3: Effective and efficient financial and risk management.The Ministry of Finance continues to be responsible for government's overall financial and risk management framework. This involves the establishment of appropriate legislation, policies, procedures and training and reporting at a corporate level to ensure the province's resources and obligations are appropriately managed in support of effective service delivery. The framework reinforces individual and corporate accountabilities for outcomes, maintains the corporate standards for stewardship of resources, management of liabilities and risk, and the collection and disbursement of public funds. Key activities included financial, procurement and accounting policy development, internal audit and advisory services, risk management, and compliance monitoring. Objectives3.1 Implement a risk-based approach to managing government resources. 3.2 Improve the government-wide accountability and responsibility framework for financial and procurement management.
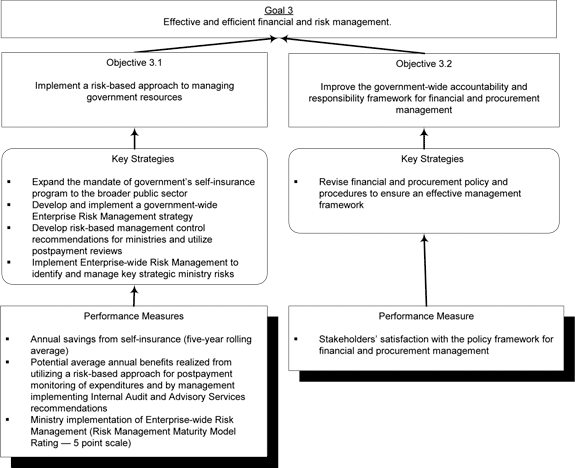
Objective 3.1: Implement a risk-based approach to managing government resources.Creation of risk-based frameworks that reinforce individual and corporate accountabilities provide opportunities to reduce unnecessary constraints, realize efficiencies and improve outcomes for the ministry and government as a whole. Risk-based practices are adopted only if they can demonstrate consistency with government priorities and add value using an optimal mix of resources and funding. Core Business: Risk Management; Financial Governance, Accounting and Reporting; and Executive and Support Services.Key Strategies
Performance Measures and Results
Objective 3.2: Improve the government-wide accountability and responsibility framework for financial and procurement management.The accountability and responsibility framework is a key management control that is increasingly important as risk-management techniques are employed government-wide. It is critical that both financial and program managers are familiar with their responsibilities for effective financial and procurement management. Core Businesses: Financial and Procurement Governance, Accounting and Reporting.Key Strategy
Performance Measures and Results
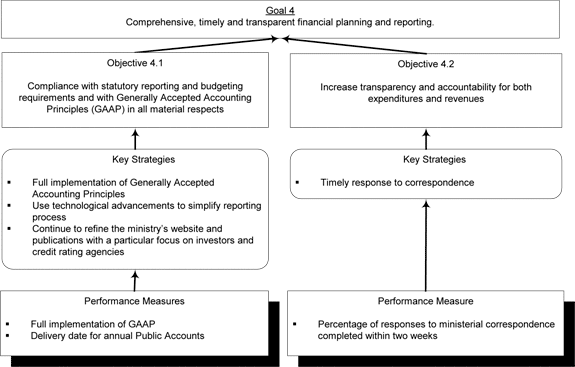
Goal 4: Comprehensive, timely and transparent financial planning and reporting.Government adhered to its legislated commitment to fully comply with Generally Accepted Accounting Principles (GAAP) beginning April 1, 2004. British Columbia is a leader among the provinces in this regard. Financial results and updated forecasts as compared to the budget are publicly reported quarterly and annually in accordance with legislated dates. Accounting practices, policies and procedures are developed and maintained in order to support the accuracy, completeness, timeliness and reliability of these reports. Accounting advice and assistance is provided on new initiatives, existing business operations and systems development. Objectives4.1 Compliance with statutory reporting and budgeting requirements and with Generally Accepted Accounting Principles (GAAP) in all material respects. 4.2 Increase transparency and accountability for both expenditures and revenues.
Objective 4.1: Compliance with statutory reporting and budgeting requirements and with Generally Accepted Accounting Principles (GAAP) in all material respects.Generally Accepted Accounting Principles for senior governments form the basis of government's accounting practices. These principles continue to be developed by the Public Sector Accounting Board, requiring that the ministry be cognizant of emerging changes and be able to apply them. The Public Accounts for fiscal 2004/05 are the first set of annual statements that are fully compliant with GAAP and without a reservation by the Auditor General. Core Business: Financial Governance, Accounting and Reporting; and Financial and Economic Performance and Analysis.Key Strategies
Performance Measures and Results
Objective 4.2: Increase transparency and accountability for both expenditures and revenues.Government remains committed to demonstrating the value generated by the resources its receives from the public. Establishing the linkages between the Estimates , ministry budgets and the activities of related core business areas are critical for understanding the products and services public funds support. Over the past year, the ministry has played an important role in creating these linkages allowing for on-going evaluations of program cost-effectiveness and potential opportunities for improvement. Meaningful transparency and accountability also requires that the ministry provide members of the public with timely responses to their inquiries. Frequently, public inquires require the input of specialized areas of the ministry and all public correspondence is treated as a matter of priority. Core Business: All.Key Strategies
Performance Measures and Results
Goal 5: A progressive, innovative and knowledgeable workforce.The ministry recognizes that the accomplishment of each of our ministry goals was dependent upon the continued support and professionalism of a highly skilled and knowledgeable workforce. It was ministry staff that drove the quality and value of the services we provided to our clients, stakeholders and the people of British Columbia. In keeping with the government's Public Sector Renewal Initiative, the ministry continued to identify opportunities to enhance leadership, support and developmental opportunities for staff. Proactive and visionary leadership was promoted at all levels of the organization. Employees were actively involved and participated in Human Resource Management Planning activities. As a result of these efforts, our clients and stakeholders benefited from a progressive, innovative and knowledgeable workforce. The outcomes included efficient, effective staff, with a clear sense of pride and purpose, serving satisfied clients. Objectives5.1 Proactive and visionary leadership. 5.2 Performance-focused workforce. 5.3 Learning and innovative organization.
Objective 5.1: Proactive and visionary leadership.The ministry actively encouraged leadership at all levels of the organization so that all employees in the ministry were provided with opportunities to develop their expertise and gain the necessary qualifications to perform well in their current positions, and to support individual career goals. This objective recognized that not everyone aspires to advancing to a leadership role, however, employees had opportunities to develop in new and different areas and the ministry supported and encouraged these opportunities. Core Businesses: All.Key Strategy
Performance Measures and ResultsNote — the performance measure results for 2004/05 are based on an employee engagement survey conducted during November 2004. Therefore, the actions taken during the second half of 2004/05 to improve Human Resource Management are not reflected in the November 2004 survey results.
Objective 5.2: Performance-focused workforce.The goals, objectives and key strategies outlined in the ministry's annual service plan provided the basis for all of the ministry's work. Accordingly, the creation of linkages between the day-to-day activities of staff and the strategic direction of the ministry were critical for the delivery of effective and results-oriented services. Staff members reaffirmed the importance of that effort. They were provided with detailed information on how their work contributed to the success of the ministry and clarified how their results supported greater job satisfaction and promoted organizational improvement. Core Businesses: All.Key Strategies
Performance Measures and Results
Objective 5.3: Learning and innovative organization.Given the pace of change in both the private and public sectors the ministry encouraged a management and operating culture that embraced new ideas and ways of doing business. Members of the ministry were provided with opportunities to accept appropriate levels of risk, to innovate and to change. This cultural shift relied upon open communication with staff, mutual trust and the development of new skills and non-traditional learning opportunities. Core Businesses: All.Key Strategy
Performance Measures and Results
DeregulationThe province's three-year deregulation initiative was fully implemented by December 31, 2004. The Ministry of Finance reported a 43 per cent net reduction in regulatory requirements by the end of the 2004/05 fiscal year. In 2004/05, a number of legislative initiatives were implemented, including:
Looking forward, ministries have been asked to look for ways to modernize the regulatory system and, in doing so, maintain a zero net increase in regulatory requirements, based on the new streamlined regulatory requirement count. We will continue to make improvements in our regulations, ensuring that we regulate in the most cost efficient and effective manner possible.
|
|||||||||||||||||||||||||||||||||||||||||||||||||||||||||||||||||||||||||||||||||||||||||||||||||||||||||||||||||||||||||||||||||||||||||||||||||||||||||||||||||||||||||||||||||||||||||||||||||||||||||||||||||||||||||||||||||||||||||||||||||||||||||||||||||||||||||||||||||||||||||||||||||||||||||||||||||||||||||||||||||||||||||||||||||||||||||||||||||||||||||||||||||||||||||||||||||||||||||||||||||||||||||||||||||||||||||||||||||||||||||||||||||||||||||||||||||||||||||||||||||||||||||||||||||||||||||||||||||||||||||||||||||||||||||||||||||||||||||||||||||||||||||||||||||||||||||||||||||||||||||||||||||||||||||||||||||||||||||||||||||||||||||||||||||||||||||||||||||||||||||||||||||||