|
|
Performance ReportingMinistry Objectives, Key Strategies, and ResultsThe objectives, key strategies and performance measures identified in this section reflect the ministry's 2002/03 – 2004/05 Service Plan. The ministry assesses its performance using results-based performance targets and measures. The past two years have seen rapid progress in this area. The ministry is shedding measures that relate simply to gross business activity or to factors beyond the ministry's control, and is developing new data collection systems to measure how the ministry's work will benefit the public and the provincial economy. The following list of measures represents a transitional phase in this evolution. Objective: To maintain and preserve provincial highways.Core business area responsible: Highway Operations Key strategy: The ministry successfully contracted and monitored maintenance activities in all areas of the province. Private sector firms delivered services such as roadside, traffic, winter and drainage maintenance through fixed price contracts in 28 service areas across the province.
The cost of maintenance is a substantial portion of the ministry budget, and the cost per lane kilometre gives an indication of how well the ministry has contained costs in this area. Cost figures include the cost of road and bridge maintenance contracts as well as maintenance activities performed by ministry staff. The increase in costs shown here is due mostly to inflation and especially to the increase in the cost of fuel. The variance in the number of lane kilometres maintained is attributed to various transactions, such as the devolution of infrastructure and incorporations, and the extension of some municipal boundaries, all of which have resulted in less kilometres for the ministry to maintain.
The overall present state rating is a measure of the contractor's performance based on random inspections of selected roads. The purpose of the inspections is to assess how well the contractor is meeting the contract requirements related to surface maintenance, drainage, roadside and winter maintenance. The ratings for each contract area are averaged to provide a province-wide Quality Assurance Rating. The trend shows that over all the maintenance contractors' compliance with standards has been consistently good.
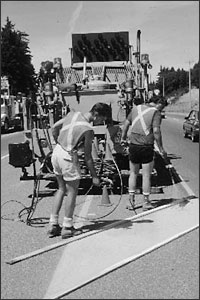
The performance measures for pavement marking are the number of line kilometres painted and the cost per line kilometre for painting highway centrelines and edgelines. The calculation encompasses all direct costs associated with pavement marking. Weather is a key variable affecting the amount of marking that is completed. Good weather through the 2002/03 program season contributed to increased productivity and a reduced cost per line kilometre.
The frequency and duration of road closures are important measures of reliability. Work to date on these measures includes a review of the data available and a proposal to develop a technological solution to improve the collection and reporting of this data. The ministry will report on progress in this area in the next Annual Service Plan Report.
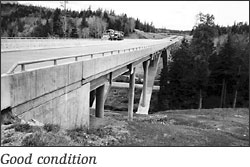
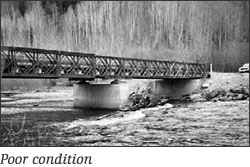
Key strategy: The Rehabilitation Program embodies a strategy to preserve and systematically replace essential highway infrastructure (roads and bridges). The ministry monitored the condition of the main highway system and its deterioration to provide a framework for the $135 million annual investment to ensure the main roads and bridges were maintained to their present overall condition. Pavement condition is measured by surface distress, which is a true engineering measure of the pavement deterioration, and pavement roughness which measures the riding comfort experienced by the road user. Combined, both types of information provide a Pavement Condition Rating, which is the basis for the ministry to determine highway rehabilitation needs. The Bridge Condition Index is a measure of the average condition of a bridge and its components. During the last few years, the results of the program have been consistent with the intended strategy based on the needs analysis. The amount of paving completed was affected by higher oil prices worldwide, which caused the condition to drop marginally by one per cent. Similarly, higher oil prices had a negative effect on the amount of road resurfacing accomplished, as the cost of asphalt and contractors' fuel costs increased.
Key strategy: While 75 per cent of our main highways are in good condition, only 34 per cent of our side roads, which are so vital to our resource industries and rural and remote communities, are in good condition. A $30 million investment was dedicated to the northern and rural/heartlands road network at the beginning of 2002/03 at $10 million annually over three years. While the effects of this investment have already started to make a difference toward addressing priority improvements in the interior of the province, the investment was not sufficient to keep up with the accelerating deterioration of the heartlands road system. A recent increase in the investment by $75 million per year will yield significant additional improvements, which will be reported in future Annual Service Plan Reports.
Crash data is gathered by the RCMP as part of its on-site accident investigation, and recorded by the Insurance Corporation of British Columbia. The data is then sent to the ministry to be input into its Highway Accident System. The RCMP data is not available until the autumn following the end of a fiscal year, and hence the actual figures shown here are data from 2001/02. The Highway Accident System does not discriminate between injury types, and therefore the figure of 34 refers to all injuries, regardless of whether they were classified as serious or not serious, hence the variance of 5.6 above the target.
Objective: To streamline operationsCore business area responsible: Highway Operations Key strategy: Ministry staff identified interim measures to significantly improve the time required to process a preliminary subdivision application. The use of screening tools such as risk assessment mapping and easier access to electronic data banks is expected to reduce the number of referrals of applications to other agencies. Improvements to the program are to be implemented as they become available. Work continued on the analysis of cost recovery options for the subdivision approvals program, with the objective of making the program self-financing in 2004/05. Key strategy: In order to deliver the Inland Ferry system at a reduced net cost to government by spring 2003, the ministry proposed to initiate a number of measures including service reductions, implementation of tolls and privatization. Potential service reductions and consultation regarding the introduction of user fees (tolls) triggered strong adverse reaction from users of the ferry system. Consequently, service reductions were scaled back, and the proposal to charge user fees starting January 1, 2003 was not implemented. The following performance measures for inland ferries show that traffic volumes were less than projected on most routes, even where service reductions were not implemented. This is attributed in part to user uncertainties about hours of service and whether or not user fees were in place. The increase in the cost per vehicle carried is attributed to the decrease in traffic volumes, increases in fuel and labour costs, and mostly to an accounting policy change which resulted in ferry refit costs of 1.6 million being expensed in 2002/03, rather than amortized over several years.
Objective: To increase regional/local input, participation and priority setting within the transportation system.Core business area responsible: Transportation Improvements Key strategy: The ministry successfully established Regional Transportation Advisory Committees that will focus initially on priorities for maintaining the road and highway system, and provide input into the ministry's annual planning processes. Key strategy: Progress toward development of an integrated transportation strategy has begun with the recent appointment of a new project director. Progress was slowed by the ministry's focus on the three-year Transportation Investment Plan, developed in conjunction with the Ministry Service Plan. A revised target date was set for March 31, 2004, which the ministry is on track to meet. Liaison with stakeholder groups continued through 2002/03. The establishment of Regional Transportation Advisory Committees will facilitate wider public consultations.
Objective: To improve the highway infrastructure and network, increasingly through public-private partnerships.Core business area responsible: Transportation Improvements Key strategy: Through the enactment of the Transportation Investment Act, the ministry established the policy and legal framework necessary to enable public-private partnerships for building/owning/financing/operating provincial highways. The act will assist the ministry with its ongoing strategy to develop partnerships and promote investment by the private sector and other levels of government in highway expansions or improvements. Key strategy: The ministry utilizes design/build procurement within a specified area of public lands, in order to make efficient use of the land and defray or reduce the costs of improvements. The measure for investments leveraged equals funds contributed from non-provincial treasury sources at the time of construction. These include contributions from municipalities, Crown corporations, First Nations and the private sector, but exclude contributions from the federal government, which are now measured separately. The contribution/recovery from partners and the land contribution by the province are measured against the gross cost of the capital project. The variance shown here is due to schedule delays for some partnerships projects, which will be made up next fiscal year.
Key strategy: The ministry continued toward completion of its legal and functional commitments, such as the Vancouver Island Highway Project, and the current Nisga'a Highway Upgrade. The ministry measures its ability to successfully complete projects on budget and on time, using the best project management practices.
Key strategy: The ministry aims to enhance capacity and reduce congestion through partnership opportunities, by providing high occupancy vehicle lanes, by operational improvements aimed at maximizing the efficiency of existing infrastructure, and by pursuing access management plans which seek an appropriate balance between highway mobility and access to lands. Segments of the highway system are categorized as urban or rural. Previous calculations for the rural congestion rate resulted in very low rates of congestion, so the reporting emphasis is now on urban areas where congestion is a growing problem. A congested condition is defined as a measured hourly traffic volume which is above 80 per cent of the highway's capacity. Actual congestion rates shown here worsen over time due to increasing population and travel demand. Reduced congestion is expected after 2006, as the benefits of major transportation improvements are realized.
Work is ongoing to determine the best method of reporting on the following measure. The ministry has contacted private trucking firms to assess the possibility of obtaining data that will support this measure; however, the feasibility of this approach remains to be confirmed.
Objective: To reduce regulatory requirements and minimize the functional and paper burden on the public, stakeholders and industry.Core business area responsible: All Key strategy: The ministry has made significant progress toward the elimination of non-essential procedures, forms, licenses and regulations that add to the cost of dealing with government. These improvements are described in the Deregulation section later in this report. Objective: To ensure a high degree of safety of British Columbia's roads by protecting the public from unfit drivers while recognizing individual needs for driving privileges.Core business area responsible: Motor Vehicle Regulation Key Strategy: In cooperation with the Insurance Corporation of British Columbia and other jurisdictions, the ministry undertook a review of driver fitness standards. As part of this process, the ministry proposed a new vision standard for national consideration through the Canadian Council of Motor Transport Administrators. The review and evaluation of the Remediation for Impaired Drivers Program led to the release of a comprehensive strategy and consultation paper in spring 2003. Objective: To regulate commercial passenger transportation to promote public access at reasonable costs, safety and an economically viable industry.Core business area responsible: Motor Vehicle Regulation Key strategy: The ministry participated in the government's Administrative Justice Project and identified ways to streamline regulation, reduce red tape and costs. The ministry also worked cooperatively with industry, the public and other transportation interests to improve the regulation of motor carriers. Proposed changes in the way the Motor Carrier Commission operates will make doing business easier for bus, taxi and limousine companies and improve enforcement, while continuing to protect public safety. Potential regulatory and legislative changes aimed at streamlining the application process have been identified and will ease the bureaucratic load on carrier businesses and provide better service for their passengers. The ministry's 2002/03 – 2004/05 Service Plan did not include a performance measure for this objective. The 2003/04 – 2005/06 Service Plan includes a relevant performance measure, i.e. the percentage reduction in the number of motor carrier regulatory requirements. Objective: To ensure ministry expenditure management meets the three-year budget target.Core business area responsible: Corporate Services Key strategy: Ongoing monitoring ensured that the ministry's budget target for 2002/03 was achieved. For details on the results, see the resource summary table in the Report on Resources section. Objective: To increase the ministry's efficiency and effectiveness.Core business area responsible: All Key strategies: Many initiatives contributed toward the successful achievement of this objective, such as:
A survey was initiated in 2002/03 to determine highway users' satisfaction with ministry services and delivery processes. The tracking of data for this measure commenced in 2002/03, and the overall rating of 6.5 for the year will be used as a baseline measurement for future years.
Objective: To increase public accountability.Core business area responsible: Corporate Services Key strategy: The 2003/04 – 2005/06 Service Plan was made available to the public on Feb. 18, 2003, in accordance with the Budget Transparency and Accountability Act (BTAA). As well, an audit confirming that the BTAA requirements have been met is nearing completion. DeregulationThe provincial government, in its New Era document, committed to cut red tape and reduce regulatory burden by 33 per cent by June 2004. These reductions are intended to eliminate obsolete and redundant regulatory requirements that waste the taxpayers' time and money, and the ministry is on track to meet the 33 per cent reduction target. From June 5, 2001 to March 31, 2003, the ministry eliminated 54 regulatory requirements and added six, for a net reduction of 48 requirements. This represented a 1.81% reduction from the previous ministry total of 2,651 regulations. Eliminated:
Added:
On April 1, 2003, the OSMV was transferred to the Ministry of Public Safety and Solicitor General, removing 1,207 regulatory requirements from the Ministry's jurisdiction, leaving a total of 1,396 requirements.
|
||||||||||||||||||||||||||||||||||||||||||||||||||||||||||||||||||||||||||||||||||||||||||||||||||||||||||||||||||||||||||||||||||||||||||||||||||||||||||||||||||||||||||||||||||||||||||||||||||||||||||||||||||||||||||||||||||||||||||||||||||||||||||||||||||||||||||||||||
|
|||||||||||||||||||||||||||||||||||||||||||||||||||||||||||||||||||||||||||||||||||||||||||||||||||||||||||||||||||||||||||||||||||||||||||||||||||||||||||||||||||||||||||||||||||||||||||||||||||||||||||||||||||||||||||||||||||||||||||||||||||||||||||||||||||||||||||||||||