|
|
||||||||||||||||||||||||||||||||||||||||||||||||||||||||||||||||||||||||||||||||||||||||||||||||||||||||||||||||||||||||||||||||||||||||||||
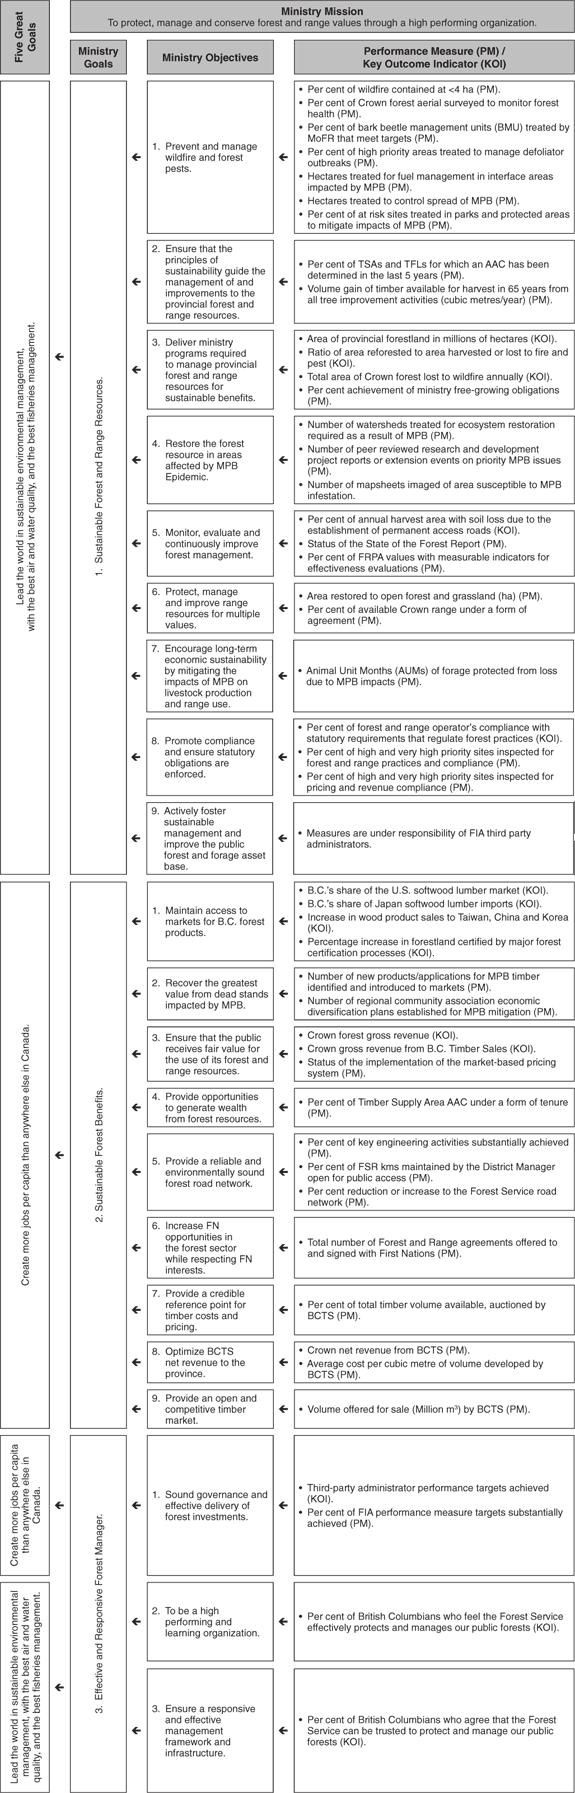
Section A: Forests and Range — ContinuedGoals, Objectives, Strategies and ResultsThis section presents the ministry's goals, indicates their linkage to the Five Great Goals and outlines how specific objectives, strategies, performance measures and targets within the eight core business areas are helping to achieve these goals. The ministry also uses key outcome indicators to track progress towards its goals. Ministry Goals and Their Linkage to the Five Great GoalsGovernment's goal to "Lead the world in sustainable environmental management, with the best air and water quality, and the best fisheries management," is directly supported by the Ministry's goal of Sustainable Forest and Range Resources. In 2005/06 MoFR will move closer towards this goal with new reforestation initiatives, implementation of performance-based regulation, implementation of the new Wildfire Act and management of mountain pine beetle impacts through implementation of the MPB Action Plan. The Ministry directly supports the Government's goal to "Create more jobs per capita than anywhere in Canada," by working to maintain a competitive forest industry, complete market pricing reform, improve market access through trade negotiations and new markets in Asia, and support rural job creation for First Nations and communities. In addition, the optimization of Crown forest revenue supports all of the Governments goals. Ministry Performance Plan SummaryThe diagram below indicates the linkage between the Five Great Goals and the ministry's mission, goals objectives, indicators and measures.
Performance PlanGoal 1:Sustainable Forest and Range Resources. As stewards of British Columbia's forest and range resources, the Ministry of Forests and Range (MoFR) has the responsibility to ensure that the use of these resources to generate economic benefits is balanced with their long-term viability. The ministry will ensure that appropriate forest and range management practices are used to maintain and improve the long-term sustainability and health of the province's forest and range resources. The ministry will also ensure that incremental investments in the forest resource are effective through the Forest Investment Account. The following key outcome indicators have been identified as indicating progress towards achievement of this goal. Sustainable Forest Land Base — This key outcome pertains to the area in provincial forest land which reflects provincial land use decisions. Changes to the indicator Area of provincial forestland (in millions of hectares) would be expected if the government removed Crown land from forest management for other uses (e.g., preservation, parks or agriculture, or Crown land sales) or converted land from other uses to forest management. For the purposes of this measure, provincial forest land is the Crown land in timber supply areas, woodlot licences and tree farm licences. Data are from the Ministry's Allowable Annual Cut (AAC) database, as of January 1st each year. This measure was 47.8 million hectares on January 1, 2003 and reduced to 47.7 million hectares in 2004. The small reduction in the productive forest area reflects updated inventory information (e.g., what is defined as productive) and minor changes to land use and administration (primarily related to protected areas and treaties over the past five years). Sustainable Timber Productivity — The ministry measures reforestation and losses from fire to represent the outcome of sustainable timber productivity. These measures use data from the past five years. Reforestation, represented by the Ratio of area reforested to area harvested or lost to fire and pest, includes planting or natural regeneration and is net of plantation failures. Harvesting is by any method. Losses to fire and pest are unsalvageable. A ratio of 1.0 indicates that areas being reforested are in balance with those being harvested or lost to fire and pests. A ratio of less than 1.0 reflects a trend towards increased Not Sufficiently Restocked (NSR) with more area being harvested or lost to fire and pest than reforested. The 2002/03 base for this measure was 0.93. Losses from fire are represented by The total area lost to wildfire annually. This is highly dependent on weather and where fires occur relative to resources and communities. The five-year rolling average in 2002/03 was 20,471 hectares. The exceptionally severe 2003 fire season, and the extreme drought of 2004 will impact the five-year rolling average of area lost for the next five years. Projections of losses have been increased to reflect 2004/05 conditions and the potential for drought to continue in 2005/06. Healthy Forests — Healthy forest ecosystems sustain the quality and quantity of soil, water and timber, and therefore, indicate sustainable forest resources. The indicator Per cent of annual harvest area with soil loss due to establishment of permanent access roads is linked to national forest criteria and indicators of global forest sustainability. Although the indicator represents a key element of healthy ecosystems (soil sustainability), it is only meaningful at the ecosystem level, needs to be considered over time, and cannot be taken by itself as a sufficient indicator of sustainability. The ministry will present more comprehensive information in a "State of the Forests" report published periodically. Permanent access roads include any not-rehabilitated roads, excavated or bladed trails, landings, pits or quarries. Harvest area is by any method and includes areas with retained mature timber and naturally occurring non-productive areas within the cut block boundary. Effective Forest and Range Protection and Management — Per cent of forest and range operators' compliance with statutory requirements that regulate forest practices reflects management decisions and actions of forest and range operators which are key to the outcome of sustainable forest resources. Information is from the ministry's Compliance Information Management System. The rate of compliance has consistently been in excess of 90 per cent for the past eight years.
Core Business Area:Protection against Fire and Pests. Objective 1:Prevent and manage wildfire and forest pests. This objective reflects the ministry's intent to protect forest and range resources and investments by minimizing losses and mitigating future risks from wildfire and forest health infestations. Key strategies include:
This objective also reflects the ministry's intent to maintain and protect public health, safety and infrastructure by reducing catastrophic wildfire risk to communities within Mountain Pine Beetle (MPB) affected areas. In addition, actions to control MPB infestations will be taken to prevent or reduce damage to forests in areas that are susceptible to but not yet experiencing epidemic infestations. Actions will also be taken to minimize or eliminate the potential for infestation spread from Crown forests, including provincial parks, into Alberta, the boreal forest other high value parks and protected areas, and to mitigate the impact on provincial parks and protected areas. Key strategies (that support the implementation of the provincially and federally funded MPB Action Plan) include:
Performance Measures:Per cent of wildfire contained at less than four hectares: This is a measure of the ministry's success rate of initial attack on wildfire that is unplanned, accidental or unwanted (i.e., has potential to cause damage to or loss of timber, range or public resources). If containment is kept to under four hectares, damage and costs for fire suppression are kept to a minimum. The base for this measure was 93 per cent in 2002/03. Data are from the ministry's Historical Fires Statistics Database. Per cent of Crown forest aerial surveyed to monitor forest health: Annual province-wide aerial surveys are used to monitor forest disturbances caused by insects, diseases, animal and abiotic factors. The findings of these surveys are posted on the ministry website for access by the public, consultants, licensees and ministry staff. The data are used to track damage trends, estimate impacts on forest resources, plan management activities strategically, and direct more detailed surveys. Data are collected from the forest regions through aerial overview surveys. Per cent of bark beetle management units (BMU) — including parks and protected areas — treated by MoFR that meet treatment targets: The exponential expansion of beetle infestation continues. High priority sites are those which present an opportunity to stop or reduce the rate of spread. Activities include conducting detailed aerial and ground detection leading to treatments through targeted harvesting, felling and burning, setting up pheromone trap trees, or other methods. By agreement with MOE, MoFR is responsible for treatments in parks and protected areas. The base for this measure was 89 per cent in 2002/03. Targets are established through the development of annual beetle strategies. (Data source: aerial and ground surveys and treatment records.) Per cent of high priority areas treated to manage defoliator outbreaks: Other defoliators include western spruce budworm, western hemlock looper and all others. The baseline was established in 2003/04 as 100 per cent for Gypsy Moth and 99 per cent for all other defoliators. The reduction in target for other defoliators from 99 per cent to 54 per cent in 2004/05 reflects the expected decrease in achievement based on a static budget and increasing infestations. Based on revised projections, the target for other defoliators will rebound to 100 per cent, provided funding levels are unaltered next year and population trends remain constant. (Data source: aerial and ground surveys and treatment records.) Hectares treated for fuel management in interface areas impacted by MPB: This is a new measure for 2005/06, of the ministry's success in reducing the fuel loading through prescribed burning, slash removal on old harvesting sites, planning and integration with other fuel management activities and removal of MPB affected stands. Data for this measure will be from third-party delivery agents under agreement to carry out these treatments (Data source: Community agreement recipients will report achievements through the program's third-party delivery agent who will report summary achievements to MoFR on a quarterly basis). Hectares treated through single tree treatments to control rate of spread of MPB: The forest districts on the eastern edge of B.C. are where the efforts to stop the spread of the beetle infestation are being concentrated. Single tree treatments are being used to prevent the spread of the beetle outside of B.C.'s borders. Data for this measure will be from licensees and third-party delivery agents under agreement to carry out these treatments (Data source: reported by districts implementing the program and specifically through assigned program staff and MAX). Per cent of at risk sites treated in parks and protected areas to mitigate impacts of the MPB infestation: This is a new measure in 2005/06, of the areas that will receive required treatments on a priority basis, to address public safety from falling snags and fire, fall and burn and fall and removal treatments (Data source: MOE, through regional co-ordinators and internal tracking mechanisms).
Core Business Area:Forest Stewardship. Objective 2:Ensure that the principles of sustainability guide the management of, and improvements to, the provincial forest and range resources. This objective reflects the ministry's goal of sustainable forest resources. Key strategies include:
Performance Measures:Per cent of TSAs and TFLs for which AAC has been determined in the last five years: This is a new measure in 2005/06, replacing "per cent of timber supply allowable annual cut determinations achieved by their scheduled deadline." The Forest Act requires that the provincial chief forester determine allowable annual cuts (AACs) for each Tree Farm Licence (TFL) and Timber Supply Area (TSA) at least once every five years. For the purposes of this measure, a postponement by the Chief Forester under the Forest Act, in cases where an AAC is not likely to be changed significantly, is considered a determination. This measure would provide a gauge of the currency of AACs in the province and serve as a rolling measure of the extent to which the timber supply review program is on schedule. (Data source: internal records.) Volume gain of timber available for harvest in 65 years from all ministry tree improvement activities: Future volume gain is calculated from a provincial growth and yield model driven by genetic worth and quantity of improved seed actually deployed. The baseline projected volume gain was 1.67 million cubic metres per year in 2002/03.
Objective 3:Deliver ministry programs required to manage provincial forest and range resources for sustainable benefits. The ministry is responsible for several key programs that help deliver the stewardship mandate of government. Key delivery strategies include:
Funding has been increased for the next three years to begin a long-term "Forests for Tomorrow" reforestation program on Provincial Crown lands. This program will further stewardship of the forest land base by reforesting productive areas impacted by fire and mountain pine beetle infestation over the past few years. The results of this program are expected to be observed in the outcome indicator "ratio of area reforested to area harvested or lost to fire and pest," about five to seven years after reforestation. Performance Measure:Per cent achievement of ministry free growing obligations: This includes the ministry's reforestation obligations under the Forest Stand Management Fund and licences to cut. This is a new measure in 2005/06, replacing "Per cent achievement of ministry free growing obligations under the Forest Stand Management Fund." This new measure more accurately represents the ministry's responsibility for reforestation resulting from sources such as non replaceable forest licences and licences to cut. Data are gathered from decisions made in the forest districts.
Objective 4:Restore the forest resource in areas affected by the Mountain Pine Beetle Epidemic (includes Provincial and Federal support for MPB Action Plan implementation). The ministry is responsible for several key initiatives working towards this objective:
Key strategies include:
Performance Measure:Number of map sheets imaged of area susceptible to MPB infestation: This new measure indicates the maps and imagery that will be generated to show current locations of MPB. (Data source: appropriate mapsheets). Number of peer-reviewed project reports or extension events on priority MPB issues: This new measure indicates the number of reports and extension events that provide MPB-related information for policy evolution and for resource planning and decision making in the areas of reforestation and restoration in riparian zones, forest productivity restoration (e.g., erosion mitigation), maintenance of biodiversity (including species at risk, anadromous fish, non-timber forest products, coarse woody debris, critical wildlife habitat structures); silviculture options and improving timber growth and value, and maintenance of watershed and hydrologic functioning (Data source: through program third-party delivery agent to the FIA Forest Science Board). Number of watersheds treated for ecosystem restoration as required as a result of MPB: Specific target watersheds and/or locations in BC are being identified for the treatments addressed by this new measure. Treatments include: mitigation options for species-at-risk; treatments in unharvested areas (e.g., old growth, protected areas, riparian areas); modification of habitat, including the use of silviculture techniques; and, treatments that improve fish passage and water quality (Data source: delivery agent for MOE reports quarterly through the MoFR's reporting process).
Objective 5:Monitor, evaluate, and continuously improve forest management. Under new results-based legislation, evaluating the outcomes of forest practices in the field will be a key indicator of how effective the legislation is at protecting forest resources. Key strategies include:
Performance Measures:Status of the "State of the Forest (SOF) Report": This report will provide a periodic assessment of the state of British Columbia forests, aligning with national criteria and indicators of sustainable forest management. This report has been designed for publishing on the Internet only, in separate reports published over a four year period, culminating in a 24-indicator report. The first report, with six indicators (Ecosystem diversity, Protected forests, Timber harvest, First Nations involvement, and Law and Certification) was delayed one year, published in March 2005. The second report with six additional indicators (Ecosystem dynamics, Species diversity, Genetic diversity, Ownership and management, Silviculture, and Jobs and communities) will be published by March 2006. The Ministry intends to follow this with two more reports each including six additional indicators to be published in March of 2007 and 2008 (Data source: internal records.) Per cent of FRPA values with measurable indicators for effectiveness evaluations: This is a new measure replacing "Number of completed effectiveness evaluations of the legislation." Effectiveness evaluations are used to determine whether policies, plans or practices under FRPA are resulting in the desired objectives being met. These field reviews are necessary to achieve ongoing improvements to the ministry's policy and legislation framework. (Data source: internal records).
Core Business Area:Range Stewardship and Grazing. Objective 6:Protect, manage and improve range resources for multiple values. This objective focuses on protecting Crown range resources through administration of rights for its use through the Range Act and agreements under FRPA. Key strategies include:
Performance Measures:Area restored to open forest and grassland (hectares): A measure of the ministry's effectiveness in restoring rangelands that have been degraded by invasive plants or in‑growth of trees. Areas are restored through treatments such as partial cutting, controlled burning and biological or chemical control of invasive species and are calculated as the area in hectares restored. (Data source for this measure is the Districts that are carrying out restoration treatments.) Per cent of available Crown range under a form of agreement: Measures the effectiveness of the ministry's allocation and administration of range available for grazing or hay cutting and is based upon possible and actual range agreement areas. In the past this measure was based on animal unit months, but the change to range agreement areas makes it more representative of the agreement tenuring process. Data are collected from the current records of forest districts.
Objective 7:Encourage long-term economic sustainability by mitigating the impacts of MPB on livestock production and range use (includes provincial and federal support for MPB Action Plan implementation). This objective reflects the ministry's intent to mitigate the impact of MPB on livestock production by controlling livestock distribution and protecting environmental values in affected communities. Key strategies include:
Performance Measures:Animal Unit Months (AUMs) of forage protected from loss due to MPB impacts: AUMs of forage authorizedmeasures how well the ministry is maintaining the production and utilization of forage in areas affected by the MPB infestation. (Data source: MoFR district.)
Core Business Area:Compliance and Enforcement (C&E). Objective 8:Promote compliance and ensure statutory obligations are enforced. Protecting the province's forest and range resources is central to fulfilling the Forest Service's mandate by upholding the law. Key strategies include:
Performance Measures:Per cent of high and very high priority sites inspected for compliance: Site visits are targeted to priority sites where environmental, social and/or economic values have been identified as being at high risk. Data is from the Compliance Information Management System.
Core Business Area:Forest Investment Account. Achievementof FIA objectives and strategies are accomplished through program activities carried out by licensees under the coordination of third-party administrators. Assessment of outcomes and outputs is captured through reports generated by the third party administrator. These reports can be found at:
Objective 9:Actively foster sustainable management and improve the public forest and forage asset base. Key strategies include:
Goal 2:Sustainable Forest Benefits. Forestry generates substantial revenues to the provincial government yielding a significant net benefit to the broader public interest and remains a major contributor to B.C.'s current and future economic health. Sustainable forest benefits rely on a strong forest economy and a globally competitive forest sector, which the ministry supports through its forest revitalization policies. The ministry also recognizes the interests of First Nations in accessing forest benefits now and in the future. The following key outcomes and indicators have been identified as indicating progress towards achievement of this goal. Revenue to the Crown — This key outcome is supported by two indicators, Crown forest gross revenue ($ billions) and Crown gross revenue from BC Timber Sales ($ millions). Crown forest gross revenue is the total amount of money charged by the ministry during the fiscal year, which includes BC Timber Sales, timber tenures and other MoFR revenues. Diversification of B.C. Export Markets — The provincial forest sector is highly dependent upon exports. The health and diversity of export markets are good indicators of the strength of the forest economy. B.C.'s share of the U.S. softwood lumber market indicates the status of B.C.'s biggest export market. B.C.'s share of Japan softwood lumber imports tracks British Columbia's second largest softwood lumber customer. Import volumes are published annually by the Japan Wood Products Information and Research Centre. The base in 2002/03 was 43 per cent (calendar year). The Increase in wood product sales to Taiwan, China and Korea indicates expansion into new markets for B.C. wood products. These areas are targeted by Forestry Innovation Investment. Globally Competitive Forest Sector — This key outcome is measured by the Percentage increase in forestland certified by major forest certification processes. Major forest certification processes are the Canadian Standards Association (CSA), Forest Stewardship Council (FSC) and the Sustainable Forest Initiative (SFI). The International Organization for Standardization (ISO) is excluded, because it does not pertain explicitly to forest management. The baseline for this measure is the 7.7 million hectares that were certified in 2001/02. In 2002/03, the number of hectares certified increased by 126 per cent to 17.4 million hectares.
Core Business Area:Pricing and selling the timber. Objective 1:Maintain access to markets for B.C. forest products. This objective reflects the ministry's intent to maintain and grow international markets and is accomplished by the following key strategies:
Objective 2:Recover the greatest value from dead stands impacted by MPB, while respecting other forest values and encourage long-term economic sustainability for communities affected by the MPB epidemic (includes provincial and federal support for MPB Action Plan implementation). This objective reflects the ministry's intent to recover the greatest value from dead stands impacted by MPB through ensuring that market access and manufacturing problems are not the limiting factor to a successful long-term salvage program, and to encourage long-term economic sustainability for communities affected by the MPB epidemic by supporting the development and implementation of strategic regional business plans for forest dependent communities and First Nations bands in the affected areas. Key strategies include:
Performance Measures:Number of new products/applications for MPB timber identified and introduced to markets: Identifying new products will help establish the profitability and value of salvage cutting rights. (Data source: FII Ltd. quarterly and annually.) Number of regional community association economic diversification plans established for MPB mitigation: A measure of the many communities and First Nation's bands that have taken the opportunity to develop economic diversification strategies that will mitigate the negative economic impacts of the MPB infestation. (Data source: grant recipients will report outcomes as part of the funding agreement.)
Objective 3:Ensure that the public receives fair value for the use of its forest and range resources now and in the future. Asserting the financial interests of the Crown by pricing and billing for revenue from Crown forest and range resources. The Coast market-based pricing system (MPS), was implemented on February 29, 2004. Key strategy for this objective is implementing the Interior market-based pricing system. Performance Measure:Status of the implementation of the market-based pricing system: The timing of the implementation of the Interior Market Pricing System is dependent and linked to the outcomes and timelines of the provincial and ministry policy reforms and initiatives (i.e., softwood lumber litigation and negotiations) currently underway.
Objective 4:Provide opportunities to generate wealth from the forest resources. By allocating, managing and monitoring forest resource opportunities through forest tenures, the ministry is able to meet social, economic and other public forest policy objectives. Key strategies include:
Performance Measure:Per cent of Timber Supply Area AAC under a form of tenure: This is a measure of the effectiveness of the ministry's apportionment of the AAC within a TSA to various programs, and its issuance of tenures, such as Forest Licences and Community Forest Agreements, under these programs. Tree Farm Licences, woodlot licences, and tenures under the BC Timber Sales program are not included. Data is from the Apportionment System. The baseline for this measure was 97 per cent in 2002/03. The targets for this measure have been reduced in each of the next three years due to the AAC uplifts resulting from the bark beetle infestation, and the reallocation of 20 per cent of the logging rights from major licensees to create new opportunities for new entrepreneurs and small operators. Additional resources have been targeted in 2005/06 to mitigate the reduction, although a positive impact on the targets is not anticipated until 2007/08 and following. (Data source: Apportionment System.)
Objective 5:Provide a reliable and environmentally sound forest road network. The intent of this objective is to provide the necessary infrastructure to access timber, range, communities, recreation, and other resource values while minimizing environmental impacts. Key strategies include:
In 2005/06, increased funding is being targeted to the replacement of priority bridges that have deteriorated on non-industrial use Forest Service roads that access communities, rural residences and priority recreational areas. Performance Measures:Per cent of key engineering activities substantially achieved (as per aggregate index): Pro-rated measure of overall performance in achieving key engineering activities consisting of Forest Service road and bridge inspection, maintenance and deactivation. (Data source: tracked internally, calculated from information collected by the forest districts.) Per cent of kilometres of Forest Service roads, where the District Manager is directly responsible for maintenance, that are open for public access: The purpose is to provide a measure of Forest Service roads open for public access in accordance with the maintenance policy. Information is reported by each district. Per cent reduction (-) or increase (+) to the Forest Service road network: The measure reflects the strategy of the ministry to balance the industrial, commercial and public use of the forest road network in a cost-effective manner reflecting the level of use. The baseline for this measure is the total kilometres of Forest Service roads excluding BCTS Forest Service roads. (Information is reported by the districts.)
Objective 6:Increase First Nation opportunities for participation in the forest sector, provide stability on the land base, and ensure forestry operations respect First Nation interests on the land base. This objective supports the ministry's intent to provide leadership, negotiation skills, advice and overall coordination with respect to forest-related First Nations' issues. Key strategies include:
Performance Measure:Total number of Forest and Range Agreements: These agreements provide a period of stability for forest and range resource development. They include the provision of economic benefits in the form of tenure and revenue sharing as well as consultative arrangements that define an agreed upon process between the ministry and a First Nation for consulting on and addressing aboriginal interests. These agreements begin with an offer to a First Nation to enter into an agreement, and the time required to conclude negotiations is variable. Offers to negotiate agreements will be made to all 176 eligible First Nations by the end of fiscal 2006/07. (Data source: tracked internally.)
Core Business Area:BC Timber Sales. BC Timber Sales is an arm's length program within the ministry, with operational and financial independence from regional and district operations. The program markets Crown timber to help establish market price (Coast only at this time) and capture the value of the asset for the public. The performance measures included in this section are only a subset of the measures tracked and reported by BC Timber Sales. For full information on BC Timber Sales resources and measures refer to the BC Timber Sales Business Plan at: http://www.for.gov.bc.ca/bcts. Objective 7:Provide a credible reference point for costs and pricing of timber harvested from public land in B.C. This objective supports market-based pricing to ensure that the public receives fair market value for the use of its forest resources. Key strategies include:
Performance Measure:Per cent of total timber volume available, auctioned by BCTS: Per cent of the total provincial ministry annual timber volume available that was auctioned by BC Timber Sales during the year. This is a key outcome indicator of the program's success in supporting the market based pricing system and being a credible reference point for costs and pricing by auctioning an increasing proportion of Provincial timber. (Data source: internal tracking and the Ministry's apportionment system.)
Objective 8:Optimize BCTS net revenue to the province, within the parameters dictated by our benchmarking mandate and sound forest management. This BCTS objective supports the generation of revenue to the Province and the ministry as a major contributor to B.C.'s current and future economic health. Key strategies include:
Performance Measures:Crown net revenue from BC Timber Sales: Net revenue is gross revenue net of capitalized expenses and period costs. This is a measure of the success of BC Timber Sales in optimizing revenue to the Province. (Data source: Harvest Billing System and the Corporate Accounting System (CAS) based on 2004 forecasts.) Average cost per cubic metre of volume developed by BCTS: This was a new measure in 2004/05 replacing the previous "Average cost per cubic metre of volume sold." The change from volume sold to volume developed is to reflect that the majority of costs are incurred during the development of a timber sale rather than later when the sale is sold. This is a measure of BC Timber Sales' performance in containing costs contributing towards optimizing net revenue and providing a credible reference point for costs and pricing of timber. (Data source: internal tracking and CAS.)
Objective 9:Provide opportunities for BCTS customers to purchase timber in an open and competitive market. This BCTS objective supports a strong forest economy and competitive forest sector. Key strategies include:
Performance Measure:Volume offered for sale by BCTS: The volume offered for sale is the gross total timber volume that BCTS offers into the market and includes all forms of tenure administered by BCTS. Therefore, in addition to advertised auction sales, volume offered for sale includes all volume associated with forestry licences to cut, and previously committed volumes for ongoing value-added sales, non-replaceable forest licences, and other forms of tenure. Unlike the measure "the per cent of total timber volume available, auctioned by BCTS" which provides statistical support for credible pricing, this output measure indicates the program's success in providing opportunities for customers to acquire timber. (Data Source: BC Timber Sales Offices.)
Goal 3:Effective and Responsive Forest Manager. The ministry is continuing to revitalize itself with a new vision and revised mission and values statements that reflect the ministry's role as steward of the province's forest resources. The effectiveness in achieving our core purpose of ensuring that sustainable forest resources deliver sustainable forest benefits for the people of British Columbia is dependent upon expert and knowledgeable staff who will continue to be innovative, responsive and performance-focused. To this end the ministry is focusing on leadership development, being a learning organization and improving organizational wellness. Additionally, under this goal the ministry oversees the effectiveness of third-party administrators who are responsible for the achievement of the Forest Investment Account (FIA) objectives and strategies. The following key outcomes and indicators (described in the glossary) have been identified as measuring progress towards achievement of this goal. The base lines for these measures were established in 2002/03 as 60 per cent and 73 per cent respectively, and they are measured every two years. Public trust in the BC Forest Service — Public trust is measured in a telephone survey conducted by BC Stats every two years. The baseline for the trust indicator was 60 per cent in 2002/03. The new effectiveness indicator is based on five variables (forest fire protection, control of pests and disease, reforestation, environmental protection, and regulating forest companies) that were combined for the single measure of overall effectiveness, which was measured as 73 per cent in the 2002/03 survey. Effective Administration of the Forest Investment Account (FIA) — This key outcome is measured by "The achievement of performance targets by the third-party administrators". The percentage is based on the number of performance targets developed by FIA third-party administrators PricewaterhouseCoopers, The Federation of BC Woodlot Association, and Forestry Innovation Investment Ltd. that are achieved within 85 per cent.
Core Business Area:Forest Investment. Objective 1:Sound governance and effective and efficient delivery of forest investments to assist government to develop a globally recognized, sustainably managed forest industry. The intent of this objective is to address the overall administration of the Forest Investment sub-vote and agreements with third-party administrators. Key strategies include:
Performance Measure:Per cent of FI performance measure targets substantially achieved: This is a new measure for the Forest Investment Account (FIA) in 2005/06. For each FIA program a number of measures have been established to track program administration performance. Please contact the Strategic Policy and Planning Branch for further information. The measure is a summary of the FIA's overall performance in the seven programs: Land Base Investment, Small Tenures, Tree Improvement, Crown Land Use Planning and Enhancement, Forest Science, Product Development and International Marketing. (Data source: tracked internally.)
Core Business Area:Executive and Support Services. Objective 2:Ensure a responsive and effective management framework and infrastructure that supports the achievement of ministry goals and objectives. This objective helps to ensure that the ministry becomes a more effective organization, which is strong, dynamic and adaptable, and focused on achieving its strategic goals. Key strategies include:
Objective 3:To be a high performing and learning organization. To continue building an innovative and even higher performing organization that focuses on both business and people performance strategies. Key strategies include:
For full details on the ministry's Human Resource Strategy, please refer to the Human Resources Plan overview at the end of the service plan.
|
|||||||||||||||||||||||||||||||||||||||||||||||||||||||||||||||||||||||||||||||||||||||||||||||||||||||||||||||||||||||||||||||||||||||||||||