|
|
||||||||||||||||||||||||||||||||||||||||||||||||||||||||||||||||||||||||||||||||||||||||||||||||||||||||||||||||||||||||||||||||||||||||||||||||||||||||||||||||||||||||||||||||||||||||||||||||||||||||||||||||||||||||||||||||||||||||||||||||||||||||||||||||||||||||||||||||||||||||||||||||||||||||||||||||||||||||||||||||||||||||||||||||||||||||||||||||||||||||||||||||||||||||||||||||||||||||||||||||||||||||||||||||||||||||||||||||||||||||||||||||||||||||||||||||||||||||||||||||||||||||||||||||||||||||||||||||||||||||||||||||||||||||||||||||||||||||||||||||||||
Report on PerformanceOverview of Ministry Goals and Linkage to Government Strategic GoalsThe Government of British Columbia Strategic Plan informs the public, the legislature and the public service of government's long-term vision. For individual ministries, the strategic plan is the guiding document for our service plans. It outlines the Province's central goals from which ministries derive their own goals and objectives relevant to their core business areas. In doing so, the efforts and accomplishments of individual ministries are linked together in the common enterprise of fulfilling government's strategic goals. The government strategic plan identifies three overarching goals: economic growth, a supportive social fabric, and healthy communities and a sustainable environment. At a fundamental level, the mandate of the Ministry of Advanced Education is germane to all three. A well-educated population and a dynamic, innovative post-secondary research sector in B.C. are increasingly recognized as essential to ensuring our long-term prosperity and competitive advantage, our social harmony and interconnectedness, and our physical and environmental well-being. At a more specific level, the ministry's goals and objectives are linked directly to two of government's strategic goals in the manner described below. Government Strategic Goal: A Supportive Social FabricMinistry Goal: A Top-Notch Post-Secondary Education SystemThe ministry contributes to a supportive social fabric in B.C. by ensuring that students have access to a wide range of high-quality post-secondary education and training programs delivered in an efficient and integrated manner. This ministry goal consists of the following three related objectives: Ministry Objective: Access and choice for B.C. post-secondary studentsThe post-secondary system will be large enough and offer a suitably diverse range of programming to meet the demand of qualified students. Opportunities to pursue post-secondary education will be available throughout the province, and barriers such as financial or geographic limitations will be minimized. Ministry Objective: A more efficient and integrated post-secondary education systemStudents will be able to progress smoothly through the post-secondary system and complete courses and programs in a reasonable amount of time. Ministry Objective: A quality post-secondary systemThe education and training that post-secondary students receive in B.C. will exhibit a standard of excellence that is comparable or superior to that available anywhere in the world. Ministry Goal: Responsive and Effective ManagementThe ministry also contributes to a supportive social fabric by ensuring that the post-secondary system exhibits sound management practices and responds quickly to the needs of its stakeholders. This ministry goal consists of the following two related objectives: Ministry Objective: Ministry business practices are efficient and effectiveThe ministry will execute its responsibilities in a manner that reflects the public interest and uses resources cost-effectively. Ministry Objective: The ministry provides leadership to the post-secondary system and ensures accountabilityThe ministry will work with post-secondary partners to ensure that the system achieves the goals and objectives inherent in government's priorities and demonstrates public accountability. Government Strategic Goal: A Strong and Vibrant Provincial EconomyMinistry Goal: Economic and Social DevelopmentThe ministry contributes to a strong and vibrant economy in B.C. by ensuring that the post-secondary system offers education and training that is relevant to the immediate and long-term needs of a modern, evolving economy, and by fostering continued growth in public post-secondary research activity. This ministry goal consists of the following two related objectives: Ministry Objective: A post-secondary system capable of knowledge generation, innovation and researchThe ministry will continue to support public post-secondary research activity, which contributes to the economic and social well-being of British Columbians through discovery, innovation and the creation of knowledge. Ministry Objective: A relevant and responsive post-secondary systemEducation and training offered through the post-secondary system will impart the knowledge and skills needed in the labour market, particularly in fields confronting skills shortages. Report on ResultsProgress toward the ministry's goals and objectives is tracked with a set of performance measures. This section presents the results achieved in 2004/05 for each measure identified in the 2004/05–2006/07 service plan, demonstrating linkages to the relevant goals and objectives. For each measure, baseline data are provided along with the target for 2004/05 and the actual results achieved based on the most current data available. The measures and targets were developed through collaboration between the ministry and system stakeholders. The aim of this collaboration was to identify a small number of critical aspects of post-secondary education that could provide accurate and reliable information about system performance. In identifying these measures, it was recognized that the diversity and complexity of post-secondary education in B.C. may produce anomalies in a given year. The baseline year for the performance measures that are based on survey data has been updated to facilitate the trend line analysis required for determining whether their targets were achieved, and to improve consistency with other measures, many of which use the 2001/02 (fiscal or academic) year as the baseline. This change does not positively affect the interpretation of the results. For more details on interpreting these measures and the targets, please refer to Appendix 1. Further information on all performance measures — such as the rationale and context for the measure, the data on which it is based and the source of the data, and methodological considerations regarding the measure — may be found in the Standards Manual for Performance Measures (see: http://www.aved.gov.bc.ca/accountability). Goal 1: A top-notch post-secondary education systemCore Business Areas: Educational Institutions and Organizations; and Debt Service Costs and Amortization of Prepaid Capital AdvancesObjective 1: Access and choice for B.C. post-secondary studentsPerformance Measure 1: Total student spaces in B.C. public post-secondary institutionsIncreasing capacity in the public post-secondary system is a ministry priority. Capacity — or the amount of seats available to those who wish to be admitted — is, along with other aspects such as affordability and population size, a key factor affecting access to post-secondary education. The ministry devotes substantial efforts and resources to increasing system capacity. In 2004/05 the ministry provided public post-secondary institutions with over $1.3 billion for operating grants, nearly $200 million for debt service capital cash flow, and nearly $67 million for annual capital allowances. This performance measure indicates whether B.C. public post-secondary institutions were able to meet the total FTE targets outlined in their 2004/05 budget and accountability letters. It is calculated using end-of-fiscal-year audited enrolment reports submitted to the ministry by public post-secondary institutions, and is expressed as a total count of actual FTEs delivered and a ratio of actual to targeted FTEs, also known as a utilization rate. Factors that may positively or negatively affect results for this measure are those that influence student demand and student retention. Some of these are beyond the ability of post-secondary institutions to control, such as local economic conditions and employment opportunities as well as demographic shifts. Other factors include institution enrolment management policies and procedures and institutional restructuring. Results
In 2004/05, the Province announced a significant expansion of the public post-secondary education system. By 2009/10 the system will grow by 25,000 spaces — from 160,848 in 2003/04 to 185,848 in 2009/10. An expansion of this magnitude requires significant effort and planning over the next few years to ensure sufficient facilities, faculty, programming and student services are put in place. Institutions and the Province are working closely together to manage this expansion in an effective and efficient manner. In the first year of the plan, the ministry funded 164,065 student FTEs. The results indicate that institutions delivered 161,681 total FTEs, 98.5 per cent of the ministry's service plan target. In the first three years of the plan, much of the growth is targeted at the university sector to address immediate challenges relating to higher-than-average student admission grade point average (GPA) requirements. Progress has been made in starting to address this challenge. In 2004/05, the university sector continued to produce more FTEs than for which universities were funded, though less so than in previous years. Institutes also show strong FTE production, producing at or over targets. Colleges and university colleges as a whole are showing less favourable results, although a number of institutions continue to meet targets. Regional demographics, changes in economic activity and lead time to implement new programs, delivery models, and facilities all influence the level of student activity. The planned addition of 25,000 student spaces by 2009/10 reflects both growth in the 18-29 year-old population and strong labour market demand for post-secondary training and education. Given the magnitude of the expansion, there may be a period of adjustment before all of the new spaces are fully utilized. The ministry will continue to analyze utilization data and work with each institution to determine if current factors affecting utilization are cyclical or structural in nature. In the 2005/06 budget and accountability letters to institutions, the ministry stated that:
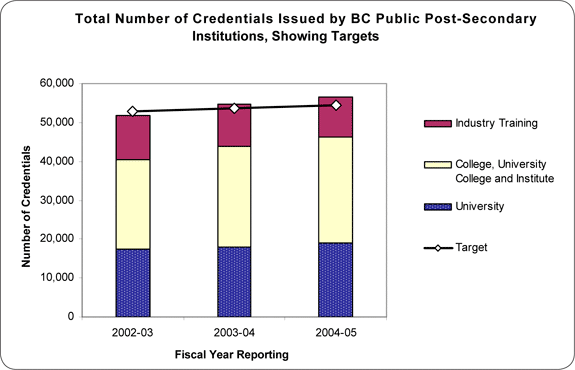
Performance Measure 2: Number of degrees, diplomas and certificates awardedAll students who fulfil program requirements at public post-secondary institutions, including apprenticeship and industry training programs at public institutions and private organizations funded through the Industry Training Authority (ITA), are entitled to a formal qualification — either a degree, diploma, or certificate (including certificates of apprenticeship, qualification and Red Seal Certification). Counting these credentials provides an understandable and recognizable indication of the system's capacity to meet student demand and to ensure sufficient numbers of graduates. This information provides a perspective on whether public post-secondary institutions and the ITA have the capacity to meet the demand of B.C. students to complete their post-secondary programs. This measure is expressed as a count of credentials awarded (issued) by public institutions and the ITA. It is calculated using data on the number of credentials awarded by public post-secondary institutions and the ITA. Baseline and annual performance data for this measure are three-year averages to account for variations caused by institutional enrolment management policies and procedures. Specifically, the baseline is a fixed three-year average, and annual performance is measured using a rolling three-year average (i.e., the 2004/05 results shown below are expressed as a three-year average ending in the 2003/04 academic year). To provide a complete picture of the post-secondary system, all credentials that fit the credential definition (i.e., credentials awarded for all programs that lead to a formal qualification, as opposed to a certificate of attendance) are included regardless of whether they are related to base funded (ministry funded) or non-base funded (contract or cost-recovery funded) educational activity (e.g., credentials issued to international students are included). Results for this measure will depend on the number of students who complete and apply for graduation from their programs. Some of the factors that may affect these results include: historical and current institution capacity (based on physical capacity and the level of funding available); personal, social and economic factors that directly affect students' participation in and completion of programs; and institution business practices and enrolment management policies and procedures. While ministry efforts to expand system capacity by increasing funding to institutions and increasing the targeted number of student FTEs may not produce comparable increases in credentials awarded immediately, by building capacity now, institutions will be able to increase the number of students who complete programs over the next few years. It is important to note that this measure does not indicate how many of the students who start programs ultimately complete them, or how long it may take them to complete. In this sense it is not a traditional graduation rate, but simply a count of program output (i.e., the number of credentials issued by institutions to students who complete programs and apply to receive a credential). Nonetheless, it is considered one of the more critical indicators of the performance of the post-secondary system. Results
The results indicate that total credentials awarded were 7.1 per cent higher than the baseline, substantially exceeding the target of 3.0 per cent over baseline. Results should be interpreted with a long-term perspective to compensate for short-term irregularities. The following graph provides a breakdown of the number of credentials awarded by public post-secondary institutions, as reported for the past three fiscal years.
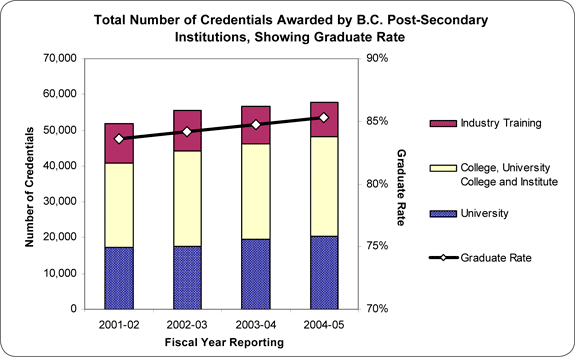
Performance Measure 3: B.C. public post-secondary graduate rateThis measure provides relational context for the implications about system capacity inferred by the number of credentials awarded (see Performance Measure 2). It is the number of credentials awarded by public institutions per 1,000 people living in B.C. aged 18-29. Specifically, it compares credential data from institutions and the ITA to population data from BC Stats. This measure is referred to as a 'graduate rate' rather than a 'graduation rate' because it compares the number of graduates to the B.C. population aged 18-29 years, not to the number of students who entered the public post-secondary system. As such, it suggests whether an increase in the number of credentials awarded exceeds the number that would be expected due to an increase in the size of the 18-29 year-old population cohort. The 18-29 year-old cohort was selected as the most appropriate representation of the age of post-secondary students in British Columbia. It is important to note that this measure is calculated using the number of credentials awarded by institutions and the ITA for the most recent academic year and the BC Stats population estimate as of July 1 of the academic year. Results
The results indicate that the increase in credentials awarded exceeded the number expected due to the natural growth in the 18-29 year-old population in B.C.
The following graph shows historical data for credentials awarded and the graduate rate as reported in fiscal years 2001/02–2004/05.
Performance Measure 4: Per cent of annual educational activity occurring between May and AugustThe ministry is committed to ensuring public post-secondary institutions maximize the efficient use of existing publicly-funded facilities before additional funds are allocated for capital expansion. One of many possible ways to increase efficiency is to promote the year-round use of facilities for student instruction. For many reasons, the period of May through August has historically been a time of reduced instructional activity at most institutions (although it may also be a period of increases in other types of activity, such as research). For those institutions that are able to offer more instructional activity during this period, doing so may ease some of their difficulty meeting student demand during the winter and may result in more efficient use of resources and capacity. This measure is intended to provide an indication of overall system progress in this regard. It is the percentage of annual instructional activity conducted during the summer academic period compared to the fall and winter academic periods. It is determined using data from public post secondary institutions. Universities provide data showing equivalent enrolments taught (EETs) through The University Presidents' Council; colleges, university colleges and institutes provide student contact hour data to the ministry's facilities branch. The rate is calculated by taking the program activity that occurs in the months May to August and dividing it by the total annual activity. It should be noted that institutions have varying ability to promote instructional activity during the summer academic period. One obstacle that many encounter is a drop in student demand at this time as students pursue jobs in seasonal industries such as tourism to help finance their education. Reduced student demand limits the ability of some institutions — particularly rural institutions — to expand their summer use cost-effectively. Nonetheless, this measure does offer useful information for capital planning and provides one perspective on system capacity. Results
The results indicate that public post-secondary institutions are increasing their utilization of facilities in the summer months. The following table shows the May-August facility utilization rates for the university and college sectors since the 2001/02 academic year. Historical Summer Facilities Utilization
Beginning with the 2005/06 fiscal year, this measure has been dropped from the ministry service plan because the ministry views overall facilities utilization as a more meaningful measure of efficiency than utilization at one particular time. However, as institutions are required to demonstrate a trend toward greater summer facilities utilization before issuing requests for capital expansion, this measure has been retained as a measure for institutional service plans issued under the Accountability Framework for British Columbia's Public Post-Secondary Education System. The ministry will continue to explore methods by which institution efficiency in the use of physical capacity can be appropriately and accurately measured. Performance Measure 5: Post-secondary participation rates for population 18-29The ministry works with public institutions to increase capacity and improve access to post-secondary education. At the same time, the population of 18-29-year-olds — the age group considered most representative of post-secondary students in B.C. — is increasing, placing additional demands on the post-secondary system. This measure was developed to provide context for efforts to increase capacity and improve access at a pace that exceeds population growth for the 18-29 year-old cohort. It was intended to provide an indication of the level of demand for post-secondary education in B.C. and whether the system has been successful in meeting that demand. Additionally, this measure was to be used to provide an inter-provincial comparison of post-secondary participation in Canada. It was calculated using enrolment data from Statistics Canada. However, Statistics Canada has been unable to provide current data, so we are unable to determine results for 2004/05. Results
Because the Statistics Canada data on which this measure was based are unavailable, this measure has been operationally re-defined for 2005/06. The revised measure will use enrolment data from B.C. public post-secondary institutions and population estimates from BC Stats. It will not provide an inter-provincial comparison of post-secondary participation but will instead compare current and historical participation within B.C. Performance Measure 6: Student spaces in developmental programs (Adult Basic Education [ABE], English as a Second Language [ESL] and Adult Special Education [ASE])Maintaining access to developmental programs like ABE, ESL and ASE is a priority for the ministry. Many adult learners, for a variety of reasons, have not achieved the level of education they need or want in order to build the future they desire for themselves and their families. Some of these learners are disadvantaged; others are newcomers to Canada. Developmental programs offer them the opportunity to gain the skills necessary to participate fully in the B.C. economy and society. Some learners enrol in order to gain their Adult Graduation Diploma. Others enrol in advanced (grade 11) and provincial (grade 12) level ABE programs to improve their grades or complete pre-requisites for post-secondary study. This measure provides an indication of the post-secondary system's capacity to accept students into these programs. It indicates whether public post-secondary institutions in British Columbia were able to meet the FTE targets for developmental programs outlined in their 2004/05 budget and accountability letters. This measure is calculated using end-of-fiscal-year audited enrolment reports submitted to the ministry by public post-secondary institutions, and is expressed as a total count of actual FTEs delivered and a ratio of actual to targeted FTEs, also known as a utilization rate. Among the factors that may positively or negatively affect results for this measure are student demand, which may be affected by changes in high school completion rates, and by student retention issues, which may be influenced by the economy or changes in the policies of other ministries and governments. Results may also be affected by institutional enrolment management policies and procedures and institutional restructuring. Results
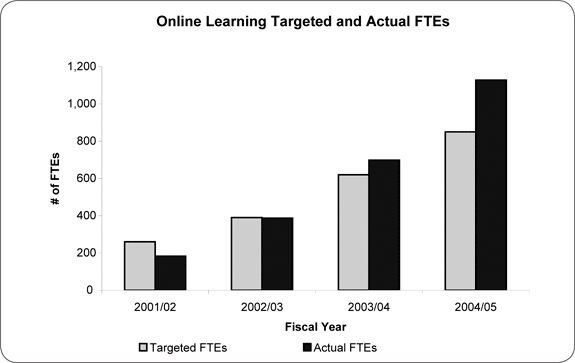
The results indicate that the total number of student FTEs in developmental programs decreased from the baseline. Student demand for developmental programs fell in a number of areas in the province in 2004/05. While some institutions reported that fewer students accessed fundamental level courses because they could find no means of income support while studying, others said improvements in local economies led to more full-time employment for people who might otherwise seek to upgrade their skills. The ministry is continuing to use the data for 2003/04 as the baseline for this measure, and the targets for future years continue to be "maintain or increase" from the baseline. The ministry will also undertake further research to determine why fewer students accessed these programs in 2004/05. Performance Measure 7: Student spaces in online learning (BCcampus) programsOnline learning programs improve access, flexibility and choice for post-secondary students. They enable students to participate in courses and programs offered by institutions across the province, regardless of a student's geographic location. This measure provides one perspective on the efforts to increase access to these programs. It indicates whether public post-secondary institutions in British Columbia were able to meet the FTE targets for online learning (BCcampus) programs outlined in their 2004/05 budget and accountability letters. It is calculated using end-of-fiscal-year audited enrolment reports submitted to the ministry by public post-secondary institutions, and is expressed as a total count of actual FTEs delivered and a ratio of actual to targeted FTEs, also known as a utilization rate. Courses considered to be online for this measure are those that are offered wholly online, that lead to an online or distance program credential, and are available to any qualified student within the province. Factors that may positively or negatively affect results for this measure include: student demand and retention issues, and institution enrolment management policies and procedures. For online learning, where part-time or single course enrolments are common, counts of FTEs typically represent more separate enrolments and individual students taught than counts of FTEs in other programs. Results
The results indicate that the number of student FTEs captured by this measure increased in 2004/05 by an amount greater than targeted. The graph below shows historical results for this measure.
As this measure counts only BCcampus online programs, it does not capture any other online programs that also contribute to improving access, flexibility and choice for students. In light of this shortcoming, this measure has not been included in the ministry's 2005/06–2007/08 service plan. The ministry is exploring options for developing a more suitable measure of online learning FTEs, and when such a measure is developed it will be included in future ministry service plans. Performance Measure 8: Number and per cent of public post-secondary student population that are AboriginalIncreasing post-secondary participation and success rates among Aboriginal people is a priority for the ministry and public post-secondary institutions. This will be realized within a post-secondary education system in which public institutions and Aboriginal organizations and institutions play important roles and are supported by the combined resources of the federal and provincial governments. The ministry and our post-secondary partners devote considerable efforts and resources to realizing this vision. For example, over the past five years the ministry has contributed $8 million through the Aboriginal Special Projects Fund to support projects that will help ensure relevant, high-quality education programs for Aboriginal learners in a wide range of areas. In addition, most public post-secondary institutions employ Aboriginal Coordinators who work with Aboriginal students, providing cultural and academic support. An indication of the level of Aboriginal student participation is revealed by this performance measure. It is the actual number of Aboriginal students in the post-secondary system and their proportion relative to the total number of students enrolled. This measure is calculated from information contained in public post-secondary institution registration and administration systems, and the Ministry of Education student database. Results for this measure must be interpreted with an awareness of the data limitations. When registering in a post-secondary program, students have the opportunity to self-identify as persons of Aboriginal ancestry. For many reasons, however, not all Aboriginal students choose to do so. Further, there are no standards for how questions about Aboriginal ancestry are phrased on student application forms, or standards for how such questions are recorded in student registration systems at institutions. As a result, public post-secondary institution registration data may under-represent the actual number of Aboriginal learners enrolled. To compensate for this limitation, counts from the administrative records of post-secondary institutions are enhanced by adding those students who were identified in K-12 administrative records as being of Aboriginal ancestry (to ensure student privacy, Freedom of Information and Protection of Privacy Act guidelines are carefully observed). This method may not provide an entirely complete picture of Aboriginal student participation in post-secondary education, but it represents best efforts under current data limitations. Results
The results suggest both an overall increase and a proportional increase in Aboriginal student participation in post-secondary education. It is important to interpret these results in context of the overall Aboriginal population growth. Statistics Canada data reveal that from 1951 to 2001, while the Canadian population doubled, the Aboriginal ancestry population grew sevenfold. In B.C. from 1996 to 2001 the overall youth population aged 15-24 grew 6.3 per cent but the Aboriginal population of the same age grew 15.9 per cent. Interestingly, the fast growing Aboriginal population is only partly due to demographic change. Another important factor is the increasing tendency of people to identify as Aboriginal. This raises the question of whether changes in Aboriginal population are explained by a true demographic change or by an increase in reporting of Aboriginal identity. Both factors may contribute to the increase in Aboriginal post-secondary participation. Therefore, the observed increase between academic years 2002/03 and 2003/04 (i.e., 3.7 per cent to 4.0 per cent) may only reflect an increase in the number of students identifying themselves as Aboriginal and/or an increase in the overall B.C. Aboriginal youth population. As data quality improves, the ministry will work to develop measures of educational outcomes for Aboriginal students. Performance Measure 9: Number of private and out-of-province public degree programs approvedTo increase access and choice for post-secondary students, government passed the Degree Authorization Act (DAA) in 2003. The DAA was intended to improve the method by which applications to offer degree programs are processed, thereby encouraging growth in the number of programs available to students. Previously, private and out-of-province public institutions wishing to grant B.C. degrees needed to obtain authority through a special act of the legislature. The DAA provided the means for a much more efficient method, eliminating the need for special legislation. Under the DAA, a Degree Quality Assessment Board was established to review applications to offer degree programs and to use the word "university" in the province. The board subjects each application to a rigorous degree quality assessment process and, if satisfied that the application meets a thorough set of criteria, it makes a recommendation to the minister that the application be approved. This measure is the count of applications approved by the minister from private post-secondary institutions and public institutions based outside B.C. that wish to offer degree programs in the province. While this measure can provide useful information about the number of new degree options available in the province, it should be noted that the ministry has no control over the number of applications received or the quality of those applications. The ministry has greatly improved the process, but it is up to institutions to take advantage of these improvements. Also, this measure indicates only those programs that have received final approval and provides no information about applications under review. Results
The results indicate that five program approvals were granted in 2004/05.
Due to the ministry's limited ability to influence results for this measure, and that it reveals only the output of an administrative
process, and that it is unclear what constitutes a 'good' or 'bad' result, this measure has not been included in the ministry's Objective 2: A more efficient and integrated post-secondary education systemPerformance Measure 10: Program completion measureThis measure was intended to indicate the ability of B.C. public universities to deliver degree programs to students in a timely and efficient manner. The 2004/05–2006/07 service plan included a placeholder for a yet-to-be developed measure of program completion and a target to develop the measure in 2004/05. Results
A measure of program completion was successfully developed in 2004/05. The measure is titled "degree completion rate," and is included in the ministry's 2005/06–2007/08 service plan. It is a two-part measure focused on students admitted to the University of British Columbia, Simon Fraser University, University of Victoria and University of Northern British Columbia. One component of the measure is the proportion of direct-entry students that complete their baccalaureate degree within seven years; the second component is the proportion of university transfer students that complete their baccalaureate degree within five years of admission to university. It is important to note that this is a measure of whether or not students complete their educational programs in a reasonable amount of time, and not a measure of how long it takes students to complete their programs. Measuring program completion at seven years for direct entry students (five years for transfer students) is based on a general consensus that the vast majority of direct entry students that are going to complete their baccalaureate program will have done so within seven years (five years for transfer students). Attempting to measure program completion at an earlier point in time (e.g., five years for direct entry students and three years for transfer students) would ignore the significant number of students who complete their programs over a longer period of time due to personal choice, stop-outs for employment purposes, and other factors. In future years this measure will provide a basis of comparison between British Columbia post-secondary institutions and those in other jurisdictions.
Performance Measure 11: Number of block and course transfer agreementsThis performance measure is intended to gauge the amount of transfer opportunity available to students in B.C. It is the number of transfer agreements arranged between institutions. The measure is calculated based on a count of active agreements registered with the BCCAT on March 31. This count includes both course-by-course transfer agreements and block transfer arrangements, which are groups of courses, often in the form of certificates or diplomas, that are recognized as having an academic wholeness or integrity, and can be related meaningfully to degree programs or other credentials. When interpreting results for this measure it should be noted that the number of transfer agreements may be affected by program changes at either sending or receiving institutions, or by reviews of agreements after a specified term. Also, a single new block transfer arrangement may replace a number of existing course-to-course agreements, which would improve transfer opportunities for students but may be perceived as a negative result from the perspective of this measure. Finally, information for this measure may be incomplete if institutions do not report all of the transfer agreements they have negotiated. Course and block transfer agreement numbers reported by BCCAT are based on a snapshot of the number of agreements registered with BCCAT on a single day of the year (March 31) and do not reflect the ongoing additions and deletions of agreements. Results
The results suggest increased access and flexibility for post-secondary students. The table below provides historical results for this measure. Historical Data
Due to the limitations of this measure described above, this measure was not included in the ministry's 2005/06–2007/08 service plan. Information concerning the efficiency of the transfer system in B.C. will continue to be obtained by the measures "Student satisfaction with transfer" and "Degree completion rate." Performance Measure 12: Student satisfaction with transferThis measure indicates how well the transfer system has integrated post-secondary education in British Columbia. It is based on student evaluation of their experience with the transfer system. The measure is calculated as the percentage of former students who transferred from one B.C. public post-secondary institution to another, who expected to transfer credit, and who indicated via survey that they were either satisfied or very satisfied with their overall transfer experience. When interpreting results it is important to note that while the measure reflects the experience of students who successfully transferred credits, it does not provide information on students who were unsuccessful in their attempt to transfer credits. Further, given that this data is obtained from student surveys, it may be possible that this measure unintentionally reflects student satisfaction with aspects of their educational experience other than their transfer experience, such as institutional capacity, availability of programs and courses, etc. Nonetheless, as a measure of how well the transfer system works for students, this may be the most effective method of obtaining direct and unambiguous information for evaluative purposes. Results
The results indicate that the target was not achieved on the basis of the declining trend line, as indicated in the graph below. However, in each of the past three years, over 85 per cent of former students were very satisfied or satisfied with their transfer experience. Also, it is worth noting that if results of the 2000 survey (85.6 per cent) were included, the trend line would be slightly inclined. Historical Data1,2
Performance Measure 13: Transfer volume measureThe rationale for developing a transfer volume measure was to provide another perspective on post-secondary system efficiency and integration based on the student transfer system. The 2004/05–2006/07 service plan included a placeholder for a yet-to-be developed measure of transfer volume and a target to develop the measure in 2004/05. Results
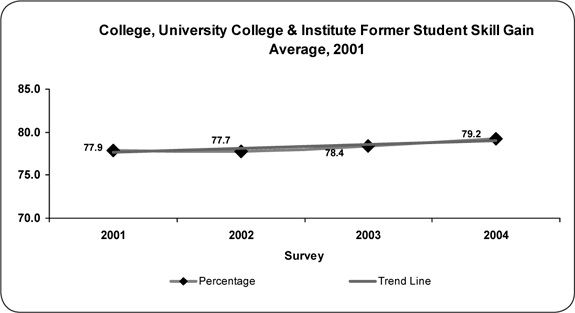
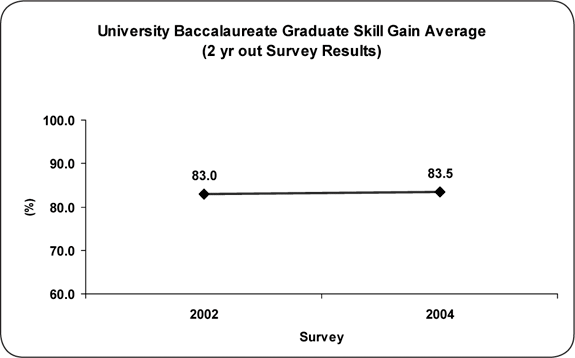
In 2004, a group of research directors from public post-secondary institutions and ministry personnel invited representatives from BCCAT to participate in discussions about options for developing a transfer volume measure. In discussion, it became evident that such a measure would not be consistent with the criteria for good performance measures. In particular, it should be implicitly 'good' or 'bad' if the results of a measure go up or down. In the case of transfer volume, considered in light of initiatives to increase access to post secondary education within communities, a decrease in transfer volume could reflect success of the access initiative. The group agreed that transfer volume provides important contextual information, but is not amenable to a target, and therefore not appropriate as a performance measure. Consequently, a performance measure was not developed. Objective 3: A quality post-secondary systemPerformance Measure 14: Student outcomes — skills gainedThis measure indicates the quality of education at B.C. public post-secondary institutions based on students' evaluation of one key educational outcome: the level of skills they gained through their educational experience. It is calculated as the percentage of former students who, when surveyed, indicated that their education helped them develop generic skills commonly regarded as necessary to lead a productive life and that are similar to the types of skills deemed necessary for successful employment by the business community and the Conference Board of Canada. It is important to note that although skill gain is an outcome of education, it is difficult to quantify because there are no mechanisms to measure a student's skill level prior to admission. Therefore, although students' assessment of the amount their skill level increased through education is an accepted indicator of education quality, this measure is not without limitations that must be considered when evaluating results. These include the limitations inherent to subjective surveying and to any attempt to measure a broad range of skills that may receive differing emphasis based on the particular program of study. Results
The results indicate that the target was substantially achieved on the basis that, for the majority of individual skill types, performance either equalled or exceeded the benchmark or there was demonstrated improvement. For university baccalaureate graduates, the benchmark was equalled or exceeded for three skill types, and for a fourth skill type (problem resolution) there was statistically significant improvement between the 2002 and 2004 surveys. For the remaining three skill types there was no statistically significant change between the 2002 and 2004 surveys. For former college, university college and institute students, the trend line was inclined or horizontal for five skill types, there was statistically significant improvement between the 2003 and 2004 surveys for one skill type (problem resolution), and there was no statistically significant change between the 2003 and 2004 surveys for one skill type (critical analysis). Beginning with the 2005/06–2007/08 service plan, the targets for this measure will be based on averages for all skill types. Historical Data1
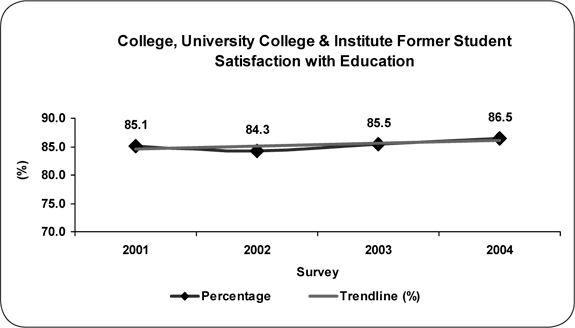
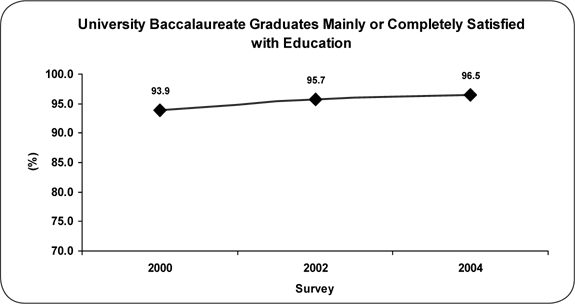
Performance Measure 15: Student satisfaction with educationAs the recipients of post-secondary education, former students are well-suited to comment on it. As such, students' assessment of how satisfied they were with their education experience is an understood and accepted measure of education quality. This measure is the percentage of former public post-secondary students who, when surveyed, indicated that they were very satisfied or satisfied with their post-secondary education. It is based on data obtained from annual student outcomes surveys. Institutions are responsible for developing, evaluating and revising the content of their instructional programs. Student satisfaction is regarded as an important consideration in these processes. In addition to the annual outcomes surveys, institutions also use a variety of methods to obtain student feedback and engage students in program development and evaluation. Examples include student participation on program development committees, student membership on institutions' governing boards, senates and education councils, and information obtained through student feedback forms. There are, of course, a number of factors beyond the control of post-secondary institutions that may affect student satisfaction, but it is expected that these factors are fairly distributed across the group of student respondents in any given year, and are relatively consistent over time. Therefore, the unique characteristics of the group of student respondents is believed to be less of a factor in their satisfaction assessment than the quality of education they received. Results
The results indicate that the target was achieved on the basis that results for university baccalaureate graduates exceeded the benchmark, and results for former college, university college and institute students demonstrated improvement over time. Historical data and trend lines for this measure are provided below. Historical Data1
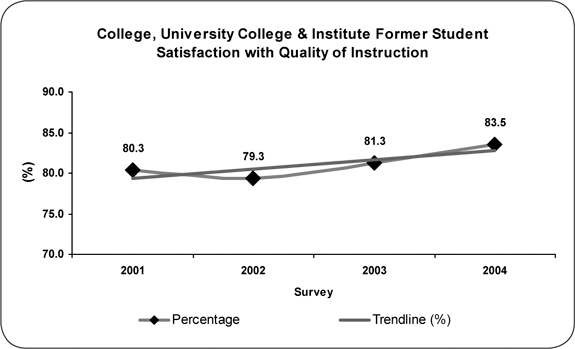
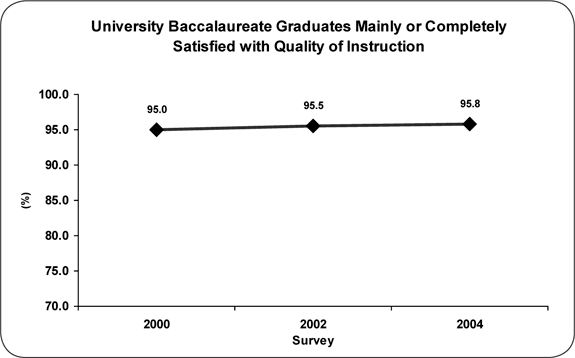
Performance Measure 16: Student assessment of quality of instructionLike Performance Measure 15, this measure is premised on the understanding that as the recipients of post-secondary instruction, former students are well-suited to comment on it. As such, students' assessment of how satisfied they were with the instruction they received is an understood and accepted measure of education quality. This measure is the percentage of former public post-secondary students who, when surveyed, rated the quality of instruction in their education program as very good or good. It is based on data obtained from annual student outcomes surveys. Post-secondary institutions seek to hire and retain high quality faculty members and instructors. The ministry, through its financial support of institutions, makes it possible for institutions to offer their faculty and instructors opportunities for professional development through study leaves, grants, release time and supplementary instruction. For example, instruction may be offered on how to use education technology to deliver courses partly or completely online. Institutions may also maintain internal organizations to train new faculty such as the University of Victoria's Learning and Teaching Centre. Another example of a system-level asset is the Provincial Instructor Diploma Program operated by Vancouver Community College, which trains new instructors in the college and institute system in instructional methods to a common standard. There are, of course, a number of factors beyond the control of post-secondary institutions that may affect student satisfaction with instruction, but it is expected that these factors are fairly distributed across the group of student respondents in any given year, and are relatively consistent over time. Therefore, the unique characteristics of the group of student respondents is believed to be less a factor in their satisfaction than the quality of education they received. Results
The results indicate that the target was achieved on the basis that results for university baccalaureate graduates exceeded the benchmark, and results for former college, university college and institute students demonstrated improvement over time. Historical data and trend lines for this measure are provided below. Historical Data1
Since decisions concerning instructional policies and procedures are made exclusively by institutions, the ministry has little means to directly influence the results for this measure. Consequently, beginning with the 2005/06 fiscal year, this measure has been dropped from the ministry service plan, although it has been retained as a measure for institutional service plans issued under the Accountability Framework For British Columbia's Public Post-Secondary Education System.
Goal 2: Economic and Social DevelopmentCore Business Areas: Educational Institutions and Organizations; Industry Training and Apprenticeship; and Student Financial Assistance ProgramsObjective 1: A post-secondary system capable of knowledge generation, innovation and researchPerformance Measure 17: Funding support for researchResearch undertaken at post-secondary institutions has a direct impact on the province's economic and social development. It generates industrial growth and improves the quality of life for British Columbians. Investing in research strengthens British Columbia's capacity for innovation, attracts highly skilled research personnel to the province, supports training for jobs in the knowledge economy, promotes networking and collaboration among researchers, and ensures the optimal use of our existing research infrastructure. Post-secondary research in B.C. spans a diverse range of disciplines and specialties. Examples include oceanography research to improve understanding of marine ecology; toxic chemical studies to ensure the safety of food and beverages from the province's agricultural and wine industries; research to identify infants at risk for language delay; and work to develop a prototype tool for use in hip replacement surgeries. This measure reflects the success of public universities and some university colleges in competing for federal research funding and attracting private investment in post-secondary research. In particular, this measure gives an indication of the success of the British Columbia Knowledge Development Fund, which enables institutions to compete for matching funds from the federal government and private industry. This measure also indicates the province's funding support for post-secondary research. It is based on data compiled by Statistics Canada and presented in a report prepared for the Canadian Association of University Business Officers (CAUBO). Universities have exclusive authority over allocating internal resources to research and developing proposals for external research funding, and they are highly motivated to increase their research capacity as it has a direct effect on their ability to attract world-class faculty and top students. Consequently, there is minimal risk that universities would not make every effort to increase their research awards. There are, however, other factors that may affect results for this measure, including changes in the criteria for federal research funding programs, the fit between new funding programs and type of research undertaken at universities, the availability of industry support, the cancellation or reduction of federal research funding due to economic decisions, and increased competition from universities in other provinces. In addition, research revenue recorded by the universities does not reflect the entirety of research funding available for university research, as an increasing amount of provincial and federal research funding flows to organizations such as Genome BC and the Michael Smith Foundation for Health Research. While university researchers may have access to this funding it would not appear in the CAUBO report, and would, therefore, not be captured by this measure. Results
The results indicate that the funding received by B.C. public post-secondary institutions from all sources increased from the baseline, and that the proportion of federal research awards directed to B.C. also increased from the baseline. Performance Measure 18: Number of licences, patents, start-up companiesAs discussed in the accompanying text for Performance Measure 17, post-secondary research activity provides numerous benefits for British Columbians. But while Performance Measure 17 looks at funding support to gauge progress toward expanding public post-secondary research capacity, this measure focuses on the commercialization of this activity and the relationship of research to economic growth. It is a count of licence/option agreements, US patents issued, start-up companies, and total income from licences received by British Columbia's three largest universities: the University of British Columbia, Simon Fraser University and the University of Victoria. It should be noted that this measure does not reflect the many non-commercial benefits of post-secondary research activity, nor the indirect economic benefits generated by start-up companies. These aspects are as important but are difficult to quantify. The ministry continues to explore options for measuring these aspects, and when suitable measures are identified, they will be included in future ministry service plans. Results
The results indicate that the number of start-up companies and the amount of licence income received were higher than in the baseline year, and that the number of licence/option agreements and U.S. patents issued were lower than in the baseline year. There are a number of factors that may have had and impact on these results. For example, the baseline year may have been exceptional in terms of patent and licensing activity or the number of researchers applying for patents may have been down. With only three universities contributing to this activity, a small fluctuation in activity would result in a large percentage difference. For example, although patents were down by 28.9 per cent, this only represents a difference of 11 patents. The same logic applies to start-up companies, which increased by 70 per cent, but which only represents seven additional start-up companies. The ratios are further affected by the number used as a denominator. Total research income for the three universities increased by an unusually large percentage (over 50 per cent) in 2002/03, likely due to an increase in the number of approvals of Canada Foundation for Innovation projects and the matching funding provided through the British Columbia Knowledge Development Fund and other sources. Consequently, in the case of licence income, even though the total increased, the ratio declined.
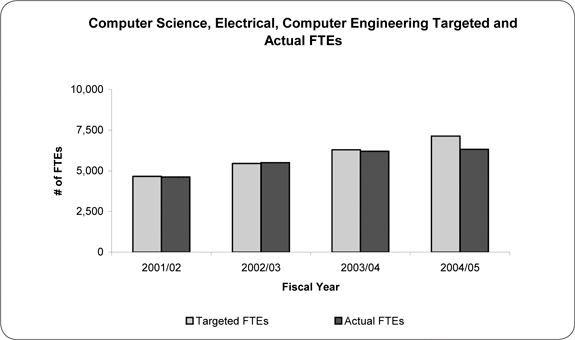
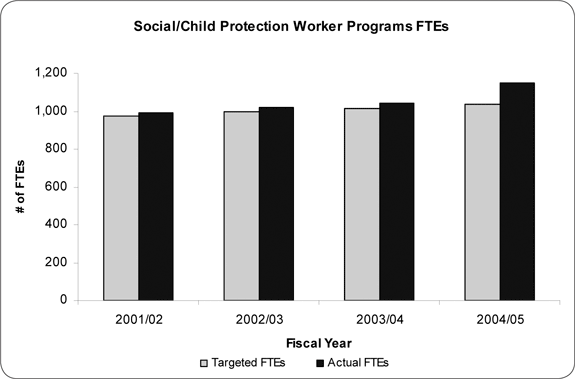
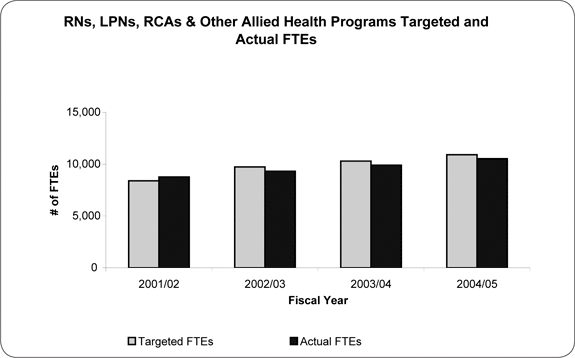
Objective 2: A relevant and responsive post-secondary systemPerformance Measure 19: Number of student spaces in identified strategic skill programsThis measure indicates whether public post-secondary institutions in British Columbia were able to meet the FTE targets outlined in their 2004/05 budget and accountability letters in the following program areas: 1) computer science, electrical and computer engineering; 2) social/child protection worker; 3) registered nurse, licensed practical nurse, registered care aide and other allied health; and 4) medical school. This measure is calculated using end-of-fiscal-year audited enrolment reports submitted to the ministry by public post-secondary institutions, and is expressed as a total count of actual FTEs delivered and a ratio of actual to targeted FTEs, also known as a utilization rate. Each program area captured by this measure trains students for occupations in fields with projected workforce shortages. Meeting demand for graduates trained in these occupations is a government priority, one that will help preserve our health care system and stimulate economic growth. To meet this demand, the ministry is working with institutions on ambitious strategies to substantially increase student FTEs in these programs. Recent examples include the development of new combined major programs for some computer science, electrical and computer engineering programs involved in the Double the Opportunity (DTO) initiative. These programs have been developed in response to student and labour market demand. Other recent examples include the introduction of the Nurse Practitioner program at the University of British Columbia (UBC) and University of Victoria (UVic) in 2003/04 and the University of Northern British Columbia (UNBC) in 2005/06, and the Medical Expansion involving UBC, UVic and UNBC in the fall of 2004. Results for this measure may be affected by changing labour market and student demand conditions, which institutions have little ability to control. These fluctuations can create challenges for institutions to meet their targets in some program areas. Other factors may include institution enrolment management policies and procedures, and administration practices in counting FTEs for these programs. The ministry continues to work with institutions on developing solutions to address future labour market shortages. Results
The results for each component of this measure are described individually below followed by graphs showing their historical results. i. Computer science, electrical and computer engineering programsGovernment's strategy to double (over five years beginning in 2002/03) the number of B.C. degree graduates in computer science, electrical and computer engineering will address expected labour market demand in these areas. The targets were established on the basis of a joint proposal from The University Presidents' Council (TUPC) and the British Columbia Technology Industries Association, and subsequent discussions with TUPC, British Columbia Institute of Technology and individual university colleges. A total of 3,410 student FTEs are required to double the number of graduates (compared to 2001/02) in the targeted academic programs.
The results this year suggest that institutions are having difficulty meeting targets. Results are lower than expected, with an overall utilization rate of 88.6% (813 FTEs below the target of 7,144). The technology sector has seen labour market fluctuations in recent years, and this is a major contributing factor to the lower utilization rate. British Columbia is expected to see robust growth in the industry in the coming years and this will no doubt be reflected in increased utilization rates for DTO in the future. The baseline and targets for this measure have been revised in the ministry's 2005/06–2007/08 service plan to reflect improved methods of defining and tracking students in DTO program areas.
ii. Social/child protection worker programsResults indicate that the target was exceeded by 114 FTEs.
iii. RNs, LPNs, RCAs and other allied health programs.These targets were realistic and were based on what institutions could accommodate in terms of facilities, clinical FTEs, faculty and available budget. The results show that actual FTEs are lower than expected. Note that the utilization varies by program areas. Most nursing programs did very well with high utilization rates. The exception was Nursing Refresher where some institutions experienced lower utilization rates due to a decreased pool of qualified applicants. There were shortfalls in allied health programs. Some institutions noted that new programs still ramping up to full capacity were under-producing as a result, but this is expected to improve once the programs are fully established. Student demand, which can be difficult to predict, and attrition, remain important factors in the underproduction in allied health programs. Utilization was significantly lower than expected for residential care aide (RCA) programs due to uncertain labour market conditions for graduates and a resulting decrease in student demand. Attrition rates tend to be highly variable in RCA programs, making them difficult for institutions to predict. The ministry will be observing the trends in programs where targets were under-achieved and look for strategies that will assist institutions in meeting program targets that are in line with employer needs. The target has been decreased in the 2005/06 service plan because the ministry was concerned that there was not enough capacity in the system to accommodate the growth originally estimated in the 2004/05 service plan.
iv. Medical school programsThe results indicate that the target for medical school programs was met.
Performance Measure 20: Number of trainees in industry trainingThe Industry Training Authority (ITA) was established in 2004 to oversee the industry training system in B.C. and to increase the number of trainees in industry training by 30 per cent by 2006/07. To support this goal the ITA developed and implemented the Accelerated Credit Enrolment in Industry Training (ACE IT) program, which allows high school students to earn credit simultaneously toward high school graduation and the technical training component of an industry training program. In addition to ACE IT, new industry training programs have been approved in response to proposals from the construction industry, including: Residential Construction Framing Technician, Construction Formwork Technician, and Reinforcement Steel Installer. The ITA maintains B.C.'s commitment to the inter-provincial Red Seal program, and ensures that new programs meet and are linked to Red Seal national standards. The ITA has also introduced new industry training policies, including an expanded definition of who can sponsor an apprentice and a clear process for challenging exams and obtaining credit for prior experience — both designed to create flexibility and make it easier for trainees/apprentices to complete their industry training requirements. This measure indicates whether the ITA was able to meet a targeted increase in the number of participants in industry training programs, as outlined in its 2004/05 budget and accountability letter. Interpreting results for this measure is complicated by the fact that it draws on two data sources with different data collection schedules. The measure is calculated using data from the Apprenticeship Information Management System (AIMS), which is maintained by the ITA, and the Central Data Warehouse (CDW), which is administered by the ministry. This data reflects industry training agreements registered with the ITA through the AIMS system and course registration in entry level trades training programs at public post-secondary institutions. Results
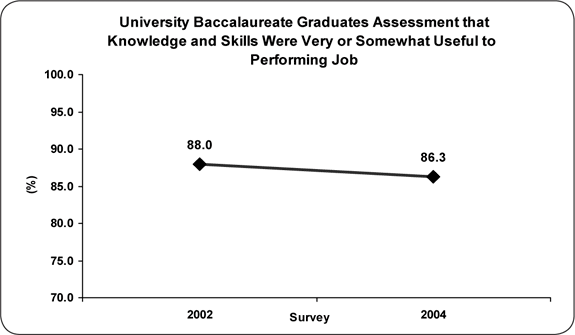
The results suggest an increase of 5,374 above the baseline, well in excess of the target. However, for the reasons identified, these results may be overstated. Performance Measure 21: Student assessment of usefulness of knowledge and skills in performing jobFor many people, a primary reason for pursuing post-secondary education is to enhance their employability with the hope that it will lead to a fulfilling career. It is, therefore, important for the ministry and post-secondary institutions to ensure that education programs impart knowledge and skills that students will need once they enter the labour market. Institutions are responsible for developing, evaluating and revising the content of their instructional programs. As a part of these processes, institutions maintain ongoing links to industry and employers in order to ensure that, where appropriate, programs provide students with knowledge and skills relevant to the needs of employers and entrepreneurs in a modern economy. This measure provides an indication of the relevance of the public post-secondary system to the labour market from the perspective of former students. As the recipients of post-secondary education, former students are well-suited to comment on its relevance to their employment. This measure is the percentage of former students who, when surveyed, indicated that the knowledge and skills they acquired through their education was very useful or somewhat useful in performing their job. It is based on data obtained through annual student outcomes surveys. Results for this measure include responses from all who were employed when surveyed regardless of whether their employment was related to their education. Responses from those not employed, however, were excluded. Results
The results indicate that the target was not achieved on the basis that the benchmark was not equalled or exceeded, and there was no demonstrated improvement over time. For former college, university college and institute students, the margin of error is too large to calculate a meaningful trend line, and the apparent increase in performance between the 2003 and 2004 surveys is not statistically significant. The decrease in performance for the university sector reflects an increase in the number of graduates employed in occupations not directly related to their education at time of survey. Former students employed in occupations unrelated to their field of study will indicate that their education was less directly useful than those employed in related occupations. Historical data for this measure are provided below. Historical Data1
Performance Measure 22: Student outcomes — unemployment rateAs discussed in the text for Performance Measure 21, many people pursue post-secondary education to enhance their employability with the hope that it will lead to a fulfilling career, so it is important that the education students receive is relevant to the labour market. This measure provides some indication of how successful former students were in making the transition from post-secondary education to employment. As such, it reflects to some extent the relevance of their education to the needs of the economy. It compares the percentage of university graduates and former college, university college and institute students who were unemployed when surveyed to the unemployment rate for British Columbians with high school credentials or less. It is based on data obtained through annual student outcomes surveys and the Statistics Canada Labour Force Survey (LFS). Results for this measure will be affected by a number of factors beyond the relevance or quality of education students received, including general economic conditions, geography (regional variations in employment), demographics (characteristics of student), and type of education program taken. Variations in unemployment rates over time are at least as likely to be influenced by general economic conditions as they are by the relevance or quality of education former students received. Nonetheless, it is widely accepted that post-secondary education influences to some extent a person's ability to obtain and maintain employment. Statistics Canada LFS data clearly show that unemployment rates for people with post-secondary education are significantly lower than for people without post-secondary education. In addition, research suggests that while individuals with post-secondary education are susceptible to changes in general economic conditions, they may experience the effects of such changes differently than individuals without post-secondary education. Results
The unemployment rate in 2004 for British Columbians aged 18-29 was 12.2 per cent. Therefore, the results indicate that university graduates and former college, university college and institute students continue to have lower unemployment rates than persons with only high school credentials or less. Unemployment Rates
Goal 3: Responsive and effective managementCore Business Areas: Student Financial Assistance Programs; and Executive and Support ServicesObjective 1: Ministry business practices are efficient and effectivePerformance Measure 23: Student aid application turnaround timeThe British Columbia Student Assistance Program (BCSAP) improves access to post-secondary education by helping eligible students manage the costs associated with their education. A BCSAP application is a one-stop process for students to apply for financial assistance through a variety of loans and grants made available by the provincial and federal governments and the Canada Millennium Scholarship Foundation. In the 2003/04 academic year, over 97,000 BCSAP applications were processed. A challenge for the ministry in administering BCSAP is providing students with a timely response to their applications. Over the past several years the introduction and expansion of the online application has been a huge advance in reducing application turnaround time. The online application eliminates data entry requirements, thereby reducing the time required to process an application. It also eliminates missing information, reducing requests for missing information. This measure reflects the results of ministry efforts to improve efficiency by reducing application turnaround time. It is the number of working days required to process student loan applications, and is calculated from internal ministry data. It is important to note that only complete applications are used in this calculation. Delays due to incomplete information are not included. Results
The results indicate that the time required to process complete applications has reduced, suggesting greater efficiency in one aspect of ministry business practices. Some applications exceeded the 10 working day processing time during the summer peak period, but the large majority of applications were processed within 10 days.
Performance Measure 24: Ministry program management as a percentage of overall ministry spendingIn recent years, the ministry has restructured its internal organization in a number of ways to improve efficiency and sharpen the focus on core business. This measure provides one perspective on the success of these efforts. It compares the ministry's total program management costs to the ministry's total operating costs. Results are calculated using internal ministry data. One potential risk associated with this measure is that changes in negotiated wage settlements and external charges may affect results. Results
The results indicate efficiency in administering ministry programs. Since this measure focuses exclusively on internal administrative matters with little public relevance, this measure has not been included in the ministry's 2005/06–2007/08 service plan. The ministry will continue to track results for this measure and will use them to help guide internal operational planning decisions. Objective 2: The ministry provides leadership to the post-secondary system and ensures accountabilityPerformance Measure 25: Per cent of colleges, university colleges and institutes meeting established thresholds for accuracy, timeliness and completenessThis measure provides one indication of accountability in the public post-secondary system: the percentage of institutions that report the required data in a timely, accurate and complete manner. The Post-Secondary Central Data Warehouse (CDW) is housed in the ministry and contains standardized student-level data submitted by 22 public institutions. Data submissions are made twice annually: June 30 and November 30.
In October 2002, the ministry implemented a Data Quality Management Plan (DQMP) to ensure that the quality of the data is sufficient for research analysis and decision-making purposes, and to satisfy accountability requirements. Under the DQMP, the ministry established thresholds concerning the timeliness, accuracy and completeness of data submissions. This measure is the percentage of institutions meeting these thresholds on their November data submission. Results
The results indicate a significant improvement in the overall quality of the CDW data submissions. The thresholds for timeliness and accuracy have been achieved on a consistent basis. Although four of the 18 thresholds for completeness were not achieved, they were missed by only small margins. The institutions have undertaken continuous improvements in their business practices and policies to achieve these results. Since this measure focuses exclusively on internal administrative matters with little public relevance, this measure has not been included in the ministry's 2005/06—2007/08 service plan. The ministry will continue to track results for this measure and will use them to help guide internal operational planning decisions.
DeregulationLimiting "red tape" and the regulatory burden in B.C. is a government priority. The intended outcome of doing so is to boost efficiency, reduce costs and stimulate innovation. To contribute to this outcome, the ministry included in the 2004/05 – 2006/07 service plan a commitment to reduce its total number of regulatory requirements to 1,241 in 2004/05, down from 1,861 in June 2001. By June 2004, the ministry had met and slightly exceeded this commitment, reducing its total number of regulatory requirements to 1,232.
|
|||||||||||||||||||||||||||||||||||||||||||||||||||||||||||||||||||||||||||||||||||||||||||||||||||||||||||||||||||||||||||||||||||||||||||||||||||||||||||||||||||||||||||||||||||||||||||||||||||||||||||||||||||||||||||||||||||||||||||||||||||||||||||||||||||||||||||||||||||||||||||||||||||||||||||||||||||||||||||||||||||||||||||||||||||||||||||||||||||||||||||||||||||||||||||||||||||||||||||||||||||||||||||||||||||||||||||||||||||||||||||||||||||||||||||||||||||||||||||||||||||||||||||||||||||||||||||||||||||||||||||||||||||||||||||||||||||||||||||||||||||||