 |
|
Performance Reporting — Continued
Achievements:
Performance Measures
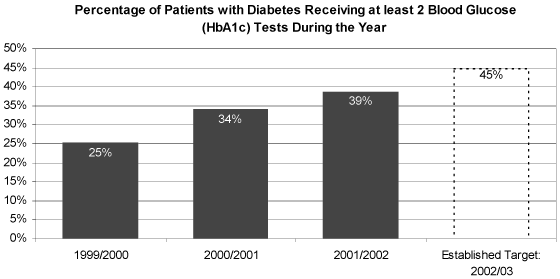
Rates of compliance with selected protocols and standards (Goal 1: PM#1) This indicator measures the number of patients with chronic illness who receive services that meet the standards and guidelines set by health professionals. The 2002/03 measurement is of the percentage of patients with diabetes receiving at least 2 blood glucose (HbA1c) tests during the year, as set in BC's diabetes guidelines. Diabetes is one of the most common chronic diseases, affecting about five per cent of Canadians, and its prevalence is expected to increase significantly due to an aging population and rising rates of obesity. Blood glucose tests help flag potential complications for persons with diabetes. Results
Source: BC Diabetes Registry, Population Health Surveillance and Epidemiology Branch, MSP Economic Analysis Branch.
Goal 1: PM#2a, 2b, and 2c
Results
Data for these three performance indicators cannot be provided within the required time frame of the Budget Transparency and Accountability Act and the Balanced Budget and Ministerial Accountability Act. As these measures are national health indicators, they will continue to be reported publicly in the Performance Indicator Reporting Committee and Canadian Institute of Health Information indictor reports. Source: AMI and Stroke: BC administrative databases; Discharge Abstract Database / Hospital Morbidity database (CIHI); POI database, Vital Statistics files, and life tables (Statistics Canada); ISQ.
Achievements:
|
||||||||||||||||||||||||||||||||||||||||||||||||||||||||||||||||||||||||||||||||||||||||||||||||||||||||||||||||||||||||||||||||||||||||||||||||||||||||||||||||||||||||||||||||||||||||||||||||||||||||||||||||||||||||||||||||||||||||||||||||||||||||||||||||||||||||||||||||||||||||||||||||||||||||||||||||||||||||||||||||||||||||||||||||||||||||||||||||||
| 2002/03 Target | 2002/03 Actual | Status |
|---|---|---|
| 5% decrease Baseline: 2000/01 |
Data for 2001/02 and 2002/03 not yet available | Pending* |
| * | Data for this measure will be available, pending the review and redevelopment of case mix groups by CIHI. |
Source: Discharge Abstract Database, Information Support, Regional Programs, BC Ministry of Health; Population tables from PEOPLE26, BC Stats.
Percentage of home and community care clients with high care needs living in their own home (intermediate care level 3 or above) (Goal 1: PM#3a)
This indicator tracks the number of seniors and people with disabilities who have high care needs and receive home support or adult day care, allowing them to remain more independent and autonomous in their own home. Clients with high care needs are those who require intermediate or extended care — intermediate care level 3 or higher.
Results
| 2002/03 Target | 2002/03 Actual | Status |
|---|---|---|
| 2% increase in the number of high care
needs clients Baseline: 2001/02 |
12.5% increase | Exceeded target |
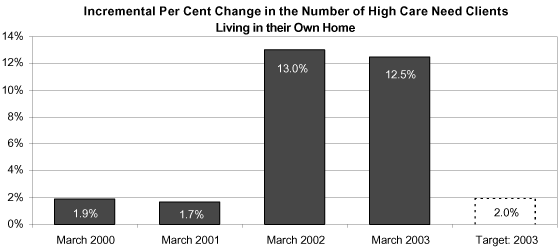
| March 1999 | March 2000 | March 2001 | March 2002 | March 2003 | |
|---|---|---|---|---|---|
| Number of High Care Need Clients Living in their Own Home | 6,292 | 6,414 | 6,523 | 7,370 | 8,292 |
| Notes: | |
| 1. | Home and community care clients living in their own home refer to those receiving home support and adult day care. |
| 2. | Those in residential care facilities refer to those in residential facilities, group homes and family care, and excludes mental health clients. |
| 3. | High care needs clients are those clients at intermediate care level 3 or above. |
| 4. | Counts of clients are made at a point in time. Data shown in the table are for March of each year. |
Source: Continuing Care Information Management Systems, Continuing Care Data Warehouse.
Alternate Level of Care (ALC) days as a percentage of total inpatient days (Goal 1: PM#3b)
This measure indicates if patients have timely access to appropriate care in the most appropriate setting. The days that patients spend in hospital after their need for acute care has ended are called Alternate Level of Care (ALC) days. Patients remain in hospital longer than necessary for various reasons, including no available room in residential facilities or a delay in discharge arrangements. A reduction in ALC days results in more acute care beds being available for those who need acute care.
Results
| 2002/03 Target | 2002/03 Preliminary* | Status* |
|---|---|---|
| 5% decrease Baseline: 2001/02 |
6.1% decrease | Exceeded target |
| * | Data are based on preliminary results to September 2002. Final results will be released in December in a supplement to this annual report. |
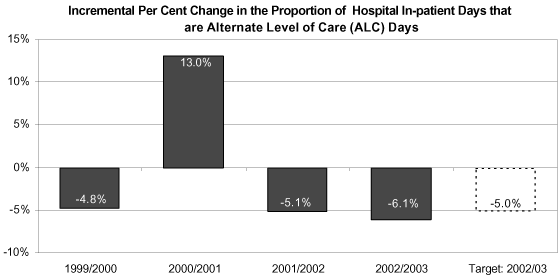
| 1999/2000 | 2000/2001 | 2001/2002 | 2002/2003* | Target: 2002/2003 | |
|---|---|---|---|---|---|
| ALC Days | 379,930 | 424,922 | 387,511 | 362,117 | |
| Inpatient Days | 2,750,961 | 2,730,992 | 2,613,268 | 2,608,313 | |
| Per Cent | 13.8% | 15.6% | 14.8% | 13.9% | 13.2% |
| Notes: | |
| 1. | 2002/03 data are based on preliminary data to September 2002. |
| 2. | Total inpatient days include acute care, rehabilitation and alternate level of care/discharge planning (no newborns). |
| 3. | ALC days include all days coded alternate level of care or discharge planning. |
| 4. | The data includes primary diagnosis and primary procedure only. |
Source: Discharge Abstract Database, Information Support, Ministry of Health Services.
Appropriate use of blood products for clinical purposes measured by utilization of Intravenous/Immune Globulin (IVIG) Blood Products (Goal 1: PM#5)
This indicator measures the use of intravenous immune globulin (IVIG), a blood product made from human plasma. This blood product is licensed for treating some clinical conditions. However, it is also being used for treating conditions not supported by medical research. The average cost of IVIG therapy is approximately $70 per gram and the cost per course of treatment regularly exceeds $10,000. Through the Provincial Blood Coordinating Office, the ministry has implemented an IVIG Utilization Management Project to monitor the use of IVIG with the goal of stabilizing and reducing use of this treatment option.
Results
| 2002/03 Target | 2002/03 Actual | Status |
|---|---|---|
| Stable (at 66.9 grams per capita) Baseline: 2001/02 |
Stable | Met target |
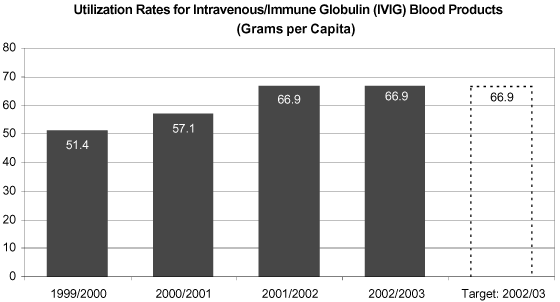
Source: Canadian Blood Services
Administrative and support services expenditures as a percentage of total expenditures, by health authority (Goal 1: PM#8)
This indicator measures the amount that health authorities spend on administrative and support services, compared to their total expenditures. Administrative services include finance services, human resources and communications. Support services include maintenance, housekeeping, food services and security. This indicator helps health authorities plan their spending and ensure every available dollar is directed towards delivering patient care.
Results
| 2002/03 Target | 2002/03 Preliminary* | Status* |
|---|---|---|
| Maintain 2000/01 percentage (24.9%) Baseline: 2000/01 |
Percentage decreased to 21.7% | Exceeded target |
| * | Result is based on information available at the time of this report. Final results will be released in December in a supplement to this annual report. |
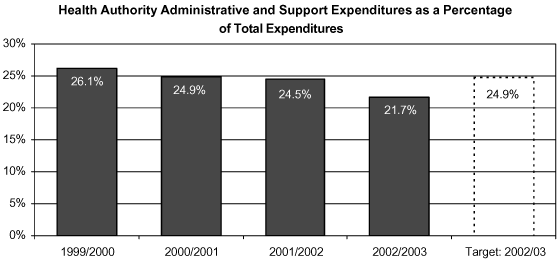
| Notes: | |
| 1. | Result is based on information available at the time of this report. Final expenditure figures may be adjusted as health authorities finalize their fiscal year end accounts. |
| 2. | The 2000/01 baseline was restated to 24.9% from 25.8%, which was published in the Ministry of Health Services' 2002/03 Service Plan. This change was a result of additional data being submitted to the ministry, plus changes resulting in consistency in the measurement of this indicator. |
| 3. | Administrative and support services expenditures include functional centres or departments for administration and support as defined by CIHI, plus functional centres for nursing inpatient services administration, ambulatory care and community services administration, to ensure consistency with ministry analysis this excludes systems support. |
Source: Health Authority Management Information System, Information Support Branch.
| Goal 1: High Quality Patient-Centred Care | |
| Objective 3: Patients have equitable and timely access to health care services. | |
| Strategies: | |
|
• Introduce strategies to improve access to basic health services (primary care). |
Underway |
|
• Modernize mental health care through the implementation of the Mental Health Plan. |
Underway |
|
• Commence implementation of a population needs-based funding formula to allocate resources to health authorities. |
Completed |
|
• Establish the Provincial Health Services Authority to reduce variability in access to specialized services across patient groups and place of residence. |
Completed |
|
• Work with the Ministry of Health Planning to implement the rural and remote health initiative. |
Underway |
|
• Expand the number of hospitals utilizing the PharmaNet system and BC BedLine. |
Completed |
Achievements:
- The Primary Health Care Renewal Project, designed to provide better access to services, has finished the initial planning phase. Health authority plans will be implemented in 2003/04. These include investment in professional and organizational development, a range of practice models including multi-disciplinary practice teams, physician collaboratives and other shared care approaches.
- A comprehensive mental health strategy was launched to: focus on early detection and evidence-based care; develop a permanent communications infrastructure to improve mental health literacy; better integrate mental health care throughout the health system; and focus on self-management and best practices.
- The Provincial Health Services Authority (PHSA) was established to ensure specialized services are delivered effectively throughout BC. It is currently developing a Provincial Perinatal Service, which will optimize care of high risk pregnant women and their infants across the province. PHSA is also working with health authorities to examine patients' needs, provincial capacity and management of wait lists, under the Cardiac Program.
- Programs such as the doctors' rural incentive agreement, rural specialist locum program, and expansion of medical school placements in regional universities encourage health professionals to live and work in rural BC.
- All acute care hospitals in BC are currently using the BC BedLine call centre to request help in transferring patients. The BC BedLine Web site is also being used by hospitals that regularly receive patient transfers. Thirty hospitals are reporting their bed availability every four hours on the Web site, and another 11 are sending daily verbal reports.
Performance Measures
![]()
Improved continuity of care measured by the proportion of persons hospitalized for a mental health diagnosis who receive community or physician follow-up within 30 days of discharge (Goal 1: PM#4a)
This measures the percentage of persons aged 15–64 who have been hospitalized for a mental health illness and who receive at least one follow-up treatment at a community-based Mental Health Centre (MHC) or with a General Practitioner/Psychiatrist, within 30 days of being discharged from hospital. A high rate of community or physician follow-up indicates well-coordinated and accessible continuity of care for people with a mental health diagnosis.
Results
| 2002/03 Target | 2002/03 Preliminary* | Status* |
|---|---|---|
| 3% increase Baseline: 2000/01 |
3.1% increase | Met target |
| * | Based on preliminary data to December 2002. Final results will be released in December in a supplement to this annual report. |
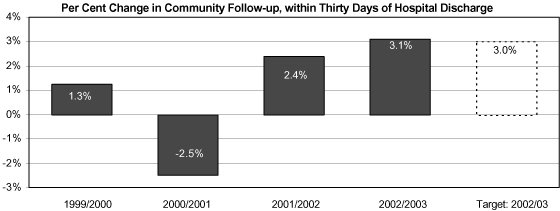
| Note: | 2002/03 data are based on preliminary data to December 2002. |
Source: Mental Health Data Warehouse and Discharge Abstracts Database, Information Support, BC Ministry of Health Services; MSP Claims.
Improved availability of community services measured by percentage of days spent by mental health patients in hospitals after the need for hospital care ended (Goal 1: PM#4bi)
This measures the number of days that Alternate Level of Care (ALC) mental health patients spend in acute care hospitals, as a proportion of all in-patient hospital days. Note that this measure is the same as the previous ALC measure, but focuses on people who are hospitalized for a mental health diagnosis.
Results
| 2002/03 Target | 2002/03 Preliminary* | Status* |
|---|---|---|
| No change (maintain or decrease
rate below rate in baseline year) Baseline: 2001/02 |
Rate decreased | Exceeded target |
| * | Based on preliminary data to December 2002. Final results will be released in December in a supplement to this annual report. |
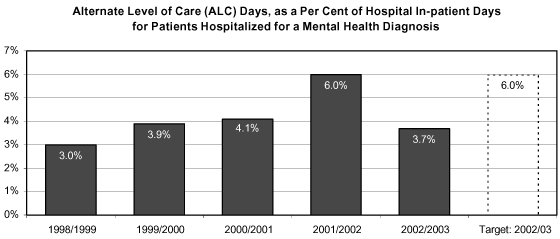
| For patients with a mental health diagnosis: | 1998/1999 | 1999/2000 | 2000/2001 | 2001/2002 | 2002/2003 |
| ALC Days | 6,720 | 8,858 | 9,467 | 13,896 | 5,040 |
| Inpatient Days | 226,042 | 227,818 | 231,847 | 232,198 | 135,544 |
| ALC Rate Per Cent | 3.0% | 3.9% | 4.1% | 6.0% | 3.7% |
| Notes: | |
| 1. | 2002/03 data are based on preliminary data to December 2002. |
| 2. | Total inpatient days include acute care, rehabilitation and alternate level of care/discharge planning (no newborns). |
| 3. | For 1999/00 and later, ALC includes all days coded alternate level of care or discharge planning. |
| 4. | The data includes primary diagnosis and primary procedure only |
Source: Discharge Abstract Database, Information Support, Regional Programs, BC Ministry of Health
Percentage of mental health clients receiving services in their own region (Goal 1: PM#4bii)
This measures the range of services that mental health clients receive in their own communities or regional health authorities. It indicates better access and greater availability of mental health care and community services for clients.
Results
| 2002/03 Target | 2002/03 Preliminary* | Status* |
|---|---|---|
| Increase (above 85.8%) Baseline: 2001/02 |
Increased | Met target |
| * | Based on partial data to January 2003. Final results will be released in December in a supplement to this annual report. |
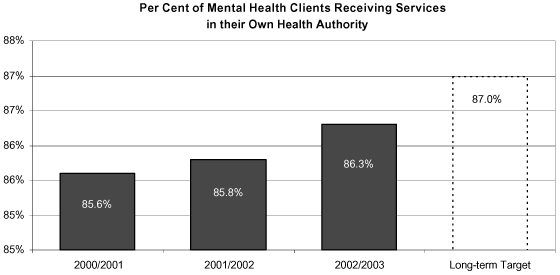
| Note: | 2002/03 data are based on preliminary data to January 2003. |
Source: Mental Health Research Data Warehouse, Information Support, BC Ministry of Health Services.
Proportion of mental health clients accessing community services (Goal 1: PM#4biii)
This indicator shows the availability of community services by measuring the percentage of people with a mental disorder who have received at least one mental health service from a care provider or health centre in the community.
Over the past five years, an increasing proportion of clients with mental illnesses are receiving care through community-based services — at a mental health centre, a physician's office or both.
Results
| 2002/03 Target | 2002/03 Actual | Status |
|---|---|---|
| Increase Baseline: 2000/01 |
Data not yet available | Pending* |
| * | Final results or data for 2002/03 will be released in December in a supplement to this annual report. |
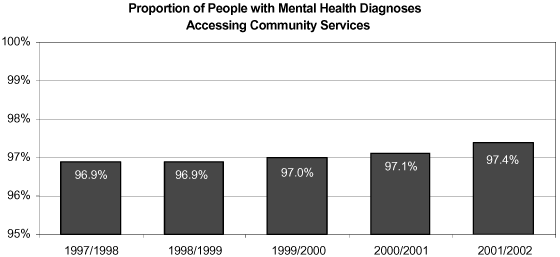
Source: Mental Health Research Data Warehouse, Information Support, BC Ministry of Health Services.
Waiting times for key services — Radiotherapy and Chemotherapy (Goal 1: PM#6a)
Monitoring wait times helps ensure patients' cancers are treated as early as possible to achieve the best outcomes. This indicator measures the percentage of patients that begin radiotherapy within four weeks of being ready to treat and the percentage of patients who start chemotherapy within two weeks of being ready to treat. The measurement is based on median wait times for these services and the number of patients treated.
As of March 2003, 87 per cent of patients requiring radiotherapy started treatment within four weeks of being ready to treat, slightly below the target of 90 per cent. The 2002/03 target value was set based on inaccurate baseline data for 2001/02, which estimated radiotherapy treatment at 88 per cent in that year when it was actually 82 per cent. Although the 2002/03 treatment rate remains below the 90 per cent target, results show a significant and steady improvement over 2000/01, when only 72 per cent of patients began treatment within four weeks. For chemotherapy, consistently, the BC Cancer Agency reports that over 90 per cent of patients receive treatment within two weeks.
The expansion of the Victoria Cancer Clinic provides more radiotherapy services in BC to meet the increasing demand for these services. Planning for a new clinic in Abbotsford will help ensure provincial services keep up with the growing incidence of cancer.
Results
| 2002/03 Target | 2002/03 Actual | Status |
|---|---|---|
| Radiotherapy: 90% of patients begin treatment within 4 weeks of being ready to treat |
Radiotherapy: 87% of patients began treatment within 4 weeks of being ready to treat |
Missed target* |
| Chemotherapy: 90% of patients begin treatment within 2 weeks of being ready to treat |
Chemotherapy: Over 90% of patients began treatment within 2 weeks of being ready to treat |
Met target |
| * | See discussion above for an explanation of the variance. |
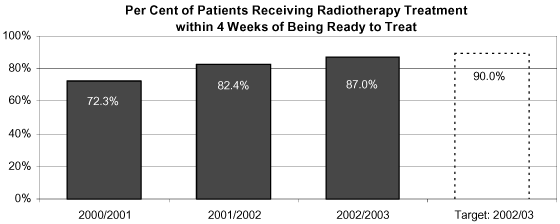
Source: BC Cancer Agency
Regional variation in access to selected services (Goal 1: PM#7)
Measuring regional rates for major surgical procedures helps compare access to services among health authorities (HA): the wider the variation, the greater the inequities in accessing services across health authorities. This indicator specifically measures utilization rates of hip, knee and cardiac surgeries for regions. Comparative data for 2002/03 showing variations across BC's regions will be available in December 2003.
Results
| 2002/03 Target | 2002/03 Actual | Status |
|---|---|---|
| Reduce variation in regional differences to access services
by 10% Baseline: 2001/02 |
Data for hip, knee and cardiac surgeries will not be available for 2002/03 until December 2003 | Pending* |
| * | Final results will be released in December in a supplement to this annual report. |
![]()
| Hip Replacement Surgeries |
Knee Replacement Surgeries | Coronary Artery Bypass Surgeries | ||||
|---|---|---|---|---|---|---|
| 2001/02 HA Range | 2002/03 Target Range | 2001/02 HA Range | 2002/03 Target Range | 2001/02 HA Range | 2002/03 Target Range | |
| Range in Surgery Rates Across Health Authorities (cases per 1,000 population) | 30.7 | 27.6 | 52.0 | 46.8 | 19.0 | 17.1 |
| Notes: | |
| 1. | The surgery and procedure rates are per 100,000 age-adjusted population in the health authority. |
| 2. | TResidents of BC treated out-of-province are included. BC non-residents are excluded. |
Source: Discharge Abstract Database, Information Support, Ministry of Health Services.
24/7 access to basic health services (primary care) (Goal 1: PM#10)
24/7 access to services is vital to improving primary health care and building a patient-centred health system in BC. Usage rates for the BC NurseLine indicate access to skilled care providers — to specially trained registered nurses — by telephone, anytime of the day or night, across the province. Further, the practice among many physicians is to direct their patients to hospital emergency departments after hours. The NurseLine provides an alternative for obtaining an objective assessment of patients' problems.
Results
| 2002/03 Target | 2002/03 Actual | Status |
|---|---|---|
| 25% increase in NurseLine use | 43% increase in NurseLine use | Exceeded target |
| 15% increase in after hour call-forwarding from physician
offices to NurseLine Baseline: 2001/02 |
203% increase in after hour call-forwarding from physician offices to NurseLine | Exceeded target |
| Number of Calls to the NurseLine | Number of Times Physicians Call Forwarded After Hours to the NurseLine |
|---|---|
| 2001/02 99,497 | 2001/02 335 (revised 01/02) |
| 2002/03 142,142 | 2002/03 1,015 |
Source: BC Ministry of Health Services
| Goal 1: High Quality Patient-Centred Care | |
| Objective 4: Patient satisfaction and public confidence in the system are increased. | |
| Strategies: | |
|
• Implement an annual mental health report card. |
Underway |
|
• Increase access to information to help patients and their families understand and manage their health through the self-care project, the NurseLine and other patient self-care approaches. |
Completed |
Achievements:
- BC HealthGuide Program: Since April 2001, over 1.8 million books have been distributed to households, health professionals, and health related agencies in BC; more than 1,000,000 hits have been made to BC HealthGuide OnLine; and 27,000 BC First Nations Health Handbooks were distributed to aboriginal communities throughout BC.
- BC NurseLine: Since opening, the BC NurseLine has provided health information and advice to over 240,000 callers.
- Through the Provincial Chronic Disease Strategy, the province gives the public and service providers Web-based access to information and tools to manage chronic diseases.
Performance Measures
![]()
Public satisfaction rates (Goal 1: PM#9)
This indicator measures peoples' level of satisfaction with health services in general and with services received in a hospital, doctor's office or community centre. This information helps identify improvements from the patient's perspective, and consequently supports system accountability and a shift towards a patient-centered health system.
Original targets were selected based on a 2001 Leger Survey1. This survey indicated that 56.6 per cent of Canadians were satisfied with the health system, compared with 41.1 per cent of respondents who were not satisfied. In BC, 46.6 per cent of respondents were satisfied with the health system. The Leger Survey has not been repeated.
The recently released 2003 Aventis Healthcare Survey, which surveyed 1,500 people with employer-sponsored health plans, found that 23 per cent of respondents said the health care system was excellent/very good and a further 58 per cent said it was good. Comparable figures at the national level were 30 per cent and 52 per cent respectively.
|
|
|
| 1 | Leger Marketing surveyed 1,507 Canadians between June 5 and 13, 2001; the results are considered accurate within 2.6% points, 19 out of 20. |
Results
| 2002/03 Target | 2002/03 Actual | Status |
|---|---|---|
| Maintain public satisfaction levels at current rate of 45 – 50% satisfied with the way health services are provided | Comparable 2002 data not available Similar data show: 23% rate health care system as excellent/good 58% rate health care system as good |
Met target |
Source: The 2003 Aventis Healthcare Survey; Research, Rogers Healthcare and Financial Services Group.
 |
||||